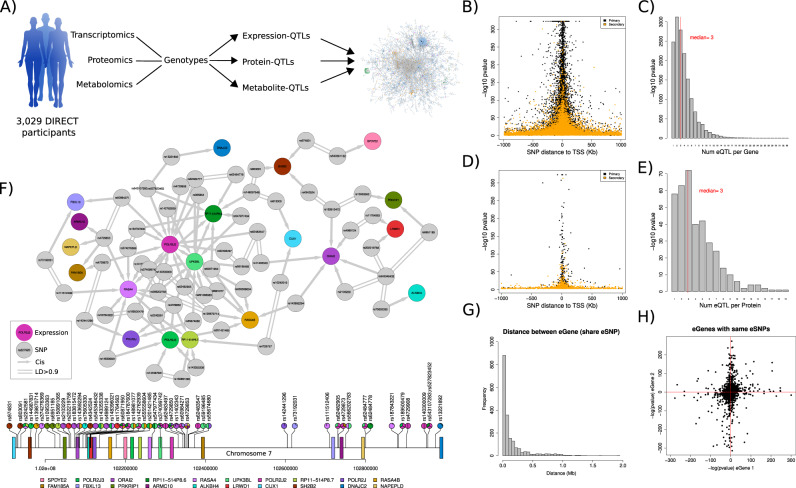
Fig. 1. Multiomic QTL analysis identifies extensive allelic heterogeneity and pleotropic effects across molecular phenotypes.
A The DIRECT consortium derived genetic, transcriptomic, proteomic and metabolite data from blood and plasma samples from 3029 individuals. Significant genetic associations (FDR < 0.05) after linear regression between the molecular phenotypes and SNPs in cis (cis-QTLs) and trans (trans-QTLs or GWAS) were used to build a network of genetic perturbations affecting molecular phenotypes. Partially created with BioRender.com. B Location of the lead eSNP with respect to the TSS of the significantly associated genes (FDR < 0.05) for cis-eQTL. The most associated eSNP per gene (primary) is shown in black (n = 15,305). Secondary cis-eQTL are shown in orange (n = 44,667). Data shows the -log10 P values of the linear regressions between gene expression and SNPs, n = 3029. C Number of cis-eQTLs per gene, ranging from 1 to 38. D The location of the SNPs acting as cis-pQTLs (pSNPs) centred around the TSS of the coding gene. The most associated pSNP per protein (primary) is shown in black (n = 373). Secondary cis-pQTL are shown in orange (n = 1217). Stronger cis-pQTLs were significantly closer to the canonical TSS of the gene coding the protein than secondary signals (Wilcoxon test = 9.54e-25). Data shows the -log10 P values of the linear regressions between proteins abundance and SNPs, n = 3027. E Number of cis-pQTLs per protein, ranging from 1 to 19. F Integration of cis-eQTLs identified the largest cis-network of local regulatory genetic effects for genes around POLR2J2. The lower lollipop plot shows the genomic location of the genes (boxes) and SNPs (lollipops), coloured by the associated genes. G Abundance of genes sharing the lead cis-eSNPs ordered by the distance between the TSS of the pair of genes in Mb. H Pairs of genes with the same lead eSNP (n = 583). Data show the -log10 P values of the linear regressions between gene expression and the common SNPs, adjusted by the direction of the effect of the eSNP.

