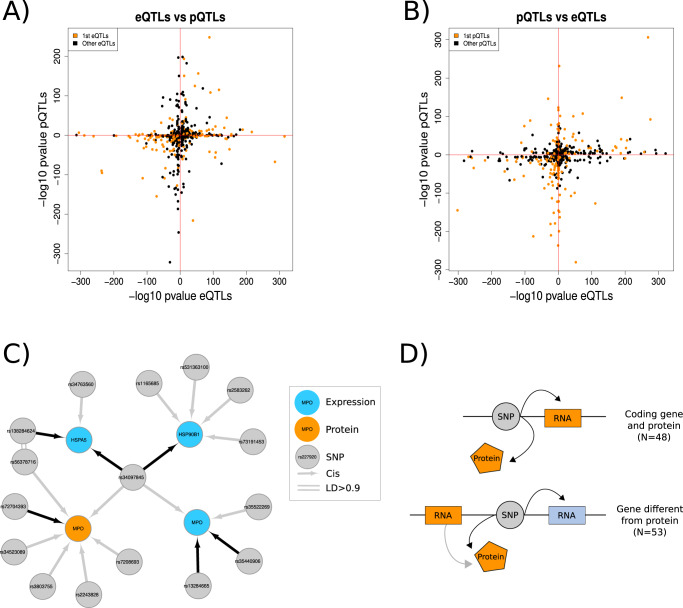
Fig. 2. Abundant pleiotropy identified across molecular phenotypes.
A, B Distribution of the P values for SNP in significant (FDR < 0.05) cis-eQTL (A) as pQTLs and for SNPs in significant (FDR < 0.05) cis-pQTLs (B) as eQTLs. Most pairs showed consistent direction of effect. Data shown are the -log10 P values of the linear regressions between gene expression or protein abundances and SNPs. C Local network of QTLs for rs34097845, a SNP significantly associated with both the expression of MPO (P value = 1.7e-10, blue) and its protein (MPO, P value = 2.08e-14, orange) with a consistent direction of effect (ßexpression = −0.87, ßprotein = −0.40). D We identified 101 trios of expression-SNP-proteins, of which 48 involved a protein and its coding gene, while 53 involved the expression of a nearby gene different that the coding gene for the protein.

