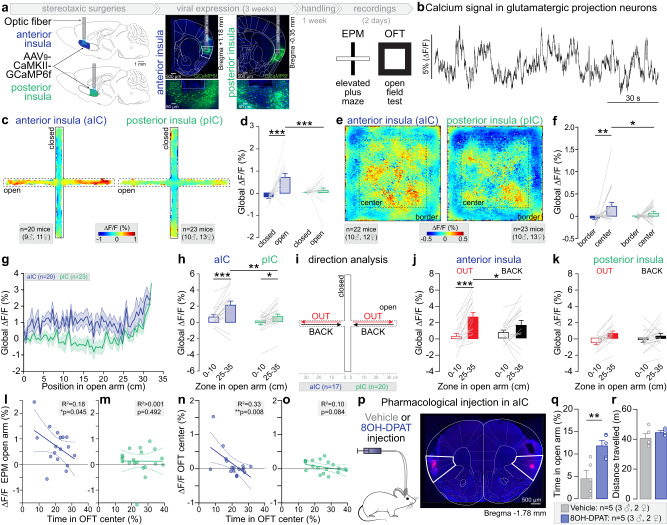
Fig. 1. Anxiety-related activity in aIC and pIC glutamatergic neurons.
a Strategy to record aIC or pIC glutamatergic neurons expressing GCaMP6f through a fiber implant. Representative confocal images of aIC and pIC neurons expressing GCaMP6f (in green). b Bulk GCaMP6f signal recorded from aIC glutamatergic neurons. ∆F/F represents the fluorescence changes from the mean level of the entire recording time series. c Averaged heat map of the calcium signal recorded from aIC and pIC neurons during 15 min of EPM test. d Average calcium signal recorded in aIC (n = 20 mice) and pIC (n = 22 mice) glutamatergic neurons in open and closed arms of the EPM (Two-way ANOVA, F(1,41) = 9.59, **p = 0.004 for the brain region (aIC, pIC), F(1,41) = 22.07, ***p < 0.001 for the zone (arms), F(1,41) = 13.19, ***p = 0.0008 for region×zone interaction). The calcium signal is higher when mice are in the open compared to closed arms for aIC neurons (Bonferroni test ***p < 0.0001) and is higher for aIC than pIC neurons when mice are in the open arms (Bonferroni test ***p < 0.001). e Averaged heat map of the calcium signal recorded from aIC or pIC neurons during the OFT test. f Average calcium signal recorded in aIC (n = 22 mice) and pIC (n = 23 mice) glutamatergic neurons in the OFT border and center (Two-way ANOVA, F(1,43) = 11.36, **p = 0.002 for the zone (arms), without effect of the brain region (aIC, pIC), and no interaction). The calcium signal in aIC neurons is higher when mice are in the center compared to the border (Bonferroni test ***p = 0.002), and is higher in aIC than pIC when mice are in the center (Bonferroni test *p = 0.043). g Average calcium signal recorded from aIC (n = 20 mice) and pIC (n = 23 mice) depending on the mice position in open arms of the EPM. h For both aIC and pIC neurons, the average calcium signal is higher when mice are at the end (25–35 cm) compared to the beginning (0–10 cm) of the open arms (Two-way ANOVA, F(1,37) = 29.60, ***p < 0.0001 for the position, F(1,37) = 9.11, **p = 0.005 for the brain region, without interaction; Bonferroni test for aIC ***p < 0.0001 and pIC *p = 0.015). The average calcium signal is higher in aIC than pIC neurons when mice are at the end of the open arms (Bonferroni test **p = 0.002, n = 18 mice for aIC, n = 21 mice for pIC). i Calcium signal analysis during open arm exploration (OUT) and retreat (BACK) in the EPM. j In aIC neurons, the calcium signal is higher when mice are at the end compared to the beginning of the open arms, only for the OUT direction (n = 17 mice, Two-way ANOVA, F(1,16) = 19.69, ***p = 0.004 for the position in the open arms, without effect of the direction and F(1,16) = 8.94, **p = 0.009 for position x direction interaction; Bonferroni test for OUT ***p < 0.0001) and the calcium signal at the end of the open arms is higher for the OUT than the BACK direction (Bonferroni test *p = 0.015). k In pIC neurons, the signal is not different depending on the mouse direction (n = 20 mice, Two-way ANOVA, F(1,19) = 21.72, ***p = 0.0002 for the position in the open arms, without effect of direction (OUT, BACK) and without interaction). l Calcium signal of aIC glutamatergic neurons when mice are in the open arms negatively correlates with the time mice spent in the OFT center (One-tailed Pearson correlation: R2 = 0.18, *p = 0.045, n = 17 mice). m Correlation of pIC glutamatergic neurons calcium signal when mice are in the open arms, with the time mice spent in the OFT center (One-tailed Pearson correlation: R2 < 0.0001, p = 0.49, n = 20 mice). n Calcium signal of aIC glutamatergic neurons in the OFT center correlates negatively with the time mice spent in the OFT center (One-tailed Pearson correlation: R2 = 0.33, **p = 0.008, n = 17 mice). o Correlation of the calcium signal of pIC glutamatergic neurons when mice are in open arms with the time spent in the OFT center (One-tailed Pearson correlation: R2 = 0.10, p = 0.08, n = 20 mice). p Representative image of a pharmacological injection in the aIC. q The time spent in the open arms is higher in mice who received 8-OH-DPAT intra-insula injection compared to the vehicle group (Two-tailed unpaired t-test, **p = 0.008, n = 5 mice). r Total distance travelled in the EPM is similar between 8-OH-DPAT and vehicle groups. All results are represented as mean ± SEM.

