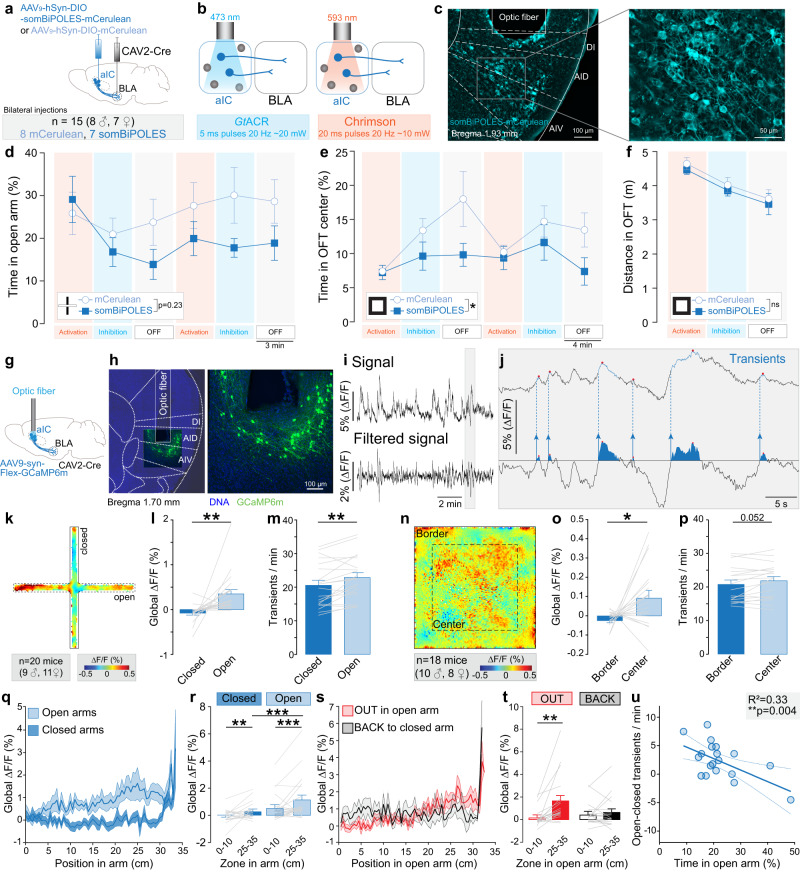
Fig. 5. Role of aIC-BLA neurons during anxiety-related behaviors.
a Experimental design including an injection of a cre-dependent viral vector to express somBiPOLES-mCerrulean (or mCerulean) in cell bodies of the aIC, and the injection of the CAV2-Cre vector in the BLA. b Pattern of somBiPOLES experimental manipulation, in which blue light (473 nm) is used to inhibit neuronal population through the soma-targeted GtACR2 component of somBiPOLES, while orange (593 nm) light is used to stimulate neuronal population through the Chrimson component of somBiPOLES. c Representative images of a coronal brain section containing aIC neurons expressing somBiPOLES below the fiber implant. d Percentage of time spent in open arms of EPM, across the 6 epochs of 3 mins. Independently of the stimulation epoch procedure, somBiPOLES group tend to spend less time in open arms compared to control mCerulean (Two-way ANOVA, time: F(3.061, 39.79) = 2.28, p = 0.09, opsin: F(1,13) = 1.596, p = 0.228, time x opsin interaction: F(5,65) = 1.610, p = 0.170, somBiPOLES n = 7 mice, mCerulean n = 8 mice). e Percentage of time spent in the center of OFT, across each epoch. Independently of the stimulation epoch procedure, somBiPOLES group spent less time in the center compared to control mCerulean (Two-way ANOVA, time: F(2.58, 33.58) = 2.792, p = 0.06, opsin: F(1,13) = 5.632, *p = 0.03, time x opsin interaction: F(5,65) = 1.132, p = 0.35, somBiPOLES n = 7 mice, mCerulean n = 8 mice). f Locomotion in open field test, as distance travelled in the arena in meters, epochs are averaged. (Two-way ANOVA, time: F(1.73, 22.47) = 19.63, *p < 0.001, opsin: F(1,13) = 0.454, p = 0.51, time x opsin interaction: F(2,26) = 0.003, p = 0.997, somBiPOLES n = 7 mice, mCerulean n = 8 mice). g Strategy for recording neuronal activity from aIC-BLA neurons in wild-type mice. AAV9-DIO-GCaMP6m was injected in aIC and CAV2-Cre in BLA and an optical fiber was implanted into aIC. h Representative images of GCaMP6m expression in aIC neurons projecting to BLA. i Fiber photometry signal recorded from aIC-BLA neurons, (Top) Bulk GCaMP6m signal, and (Bottom) filtered GCaMP6m signal for calcium transient detection. ∆F/F represents the fluorescent changes from the mean level of the entire recording time series. j Representation of automated transient detection. Filtered GCaMP6m peaks exceeding the threshold (horizontal line in the lower trace) were identified as transients. k Averaged heat map of global calcium signal recorded from aIC-BLA neurons during EPM test. l Global calcium signal is increased in the open arms compared to the closed arms (Two-tailed paired t-test, t = 3.174, **p = 0.005, n = 20 mice). m Calcium transients frequency is increased in open arms compared to closed arms (Two-tailed paired t-test, t = 3.249, **p = 0.004, n = 20 mice). n. Averaged heat map of global calcium signal recorded from aIC-BLA neurons during OFT test (n = 18 mice). o Global calcium signal is increased in the center compared to the border of the OFT (Two-tailed paired t-test, t = 2.249, *p = 0.021, n = 18 mice). p Calcium transient frequency tends to increase in the center compared to the border of the OFT (Two-tailed paired t-test, t = 2.091, p = 0.052, n = 18 mice). q Average calcium signal along the position in the open and closed arms of the EPM. r Calcium signal in the open and closed arms increases at the extremity (25-35 cm) compared to the beginning (0–10 cm) of the arms (n = 20 mice, Two-way ANOVA, F(1,19) = 6.301, *p = 0.02 for the arms (Open, Closed), F(1,19) = 6.8, *p = 0.017 for the position (0–10 vs 25–35 cm) and F(1,19) = 4.509, *p = 0.047 for arms x position interaction; Bonferroni test for open arms ***p < 0.0001 and for closed arms **p = 0.006), and the signal is higher at the extremity of the open than the closed arms (Bonferroni test ***p < 0.0001). s Average calcium signal along the position in the open arms of the EPM while the animal is navigating OUT to the end of the arms or BACK to the center. t Average signal is higher when mice are at the extremity compared to the beginning of the open arm only for the OUT direction (n = 18 mice, Two-way ANOVA, F(1,17) = 8.42, **p = 0.01 for the position (0–10 vs 25–35 cm), no effect of direction (OUT, BACK), and F(1,17) = 7.95, *p = 0.012 for position x direction interaction; Bonferroni test for OUT **p = 0.0015). u Differential calcium transients frequency (open-closed) correlates with the time mice spent in open arms (One-tailed Pearson correlation: R2 = 0.3288, **p = 0.0041, n = 20 mice). All the results are represented as mean ± SEM.

