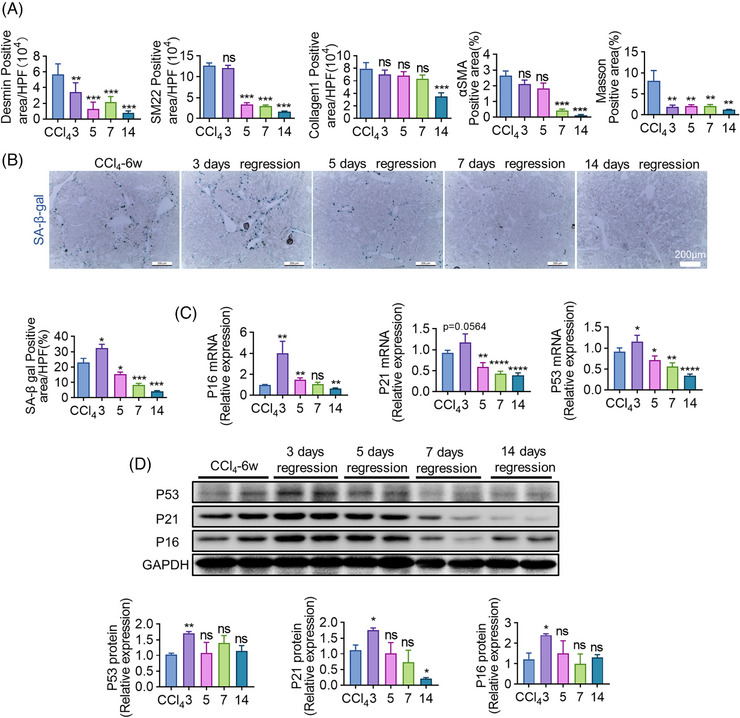
FIGURE 1.

The emergence of accumulated senescent cells during fibrosis regression. (A) The quantification of positive areas of IF (Desmin, SM22, Collagen1) and IHC (αSMA, Masson) staining of livers on days 3, 5, 7, and day 14 of regression. Mice sacrificed immediately after the 12th CCl4 injection served as control. (B) Frozen sections of livers were stained with a Senescence β‐galactosidase Staining Kit (SA‐β‐gal Kit). Positive areas of SA‐β‐gal were quantitatively compared. (C) Relative mRNA expressions of senescence‐related molecules including P16, P21, and P53 in isolated macrophages were determined using RT‐qPCR during the regression of liver fibrosis; β‐actin gene was used as an internal reference. (D) WB analyses of P16, P21, and P53 expression of isolated macrophages at various time points of regression; GAPDH served as an internal control. Bars = means ± SD; n = 2–4; *p < 0.05, **p < 0.01, ***p < 0.001, ****p < 0.0001; ns, not significant.
