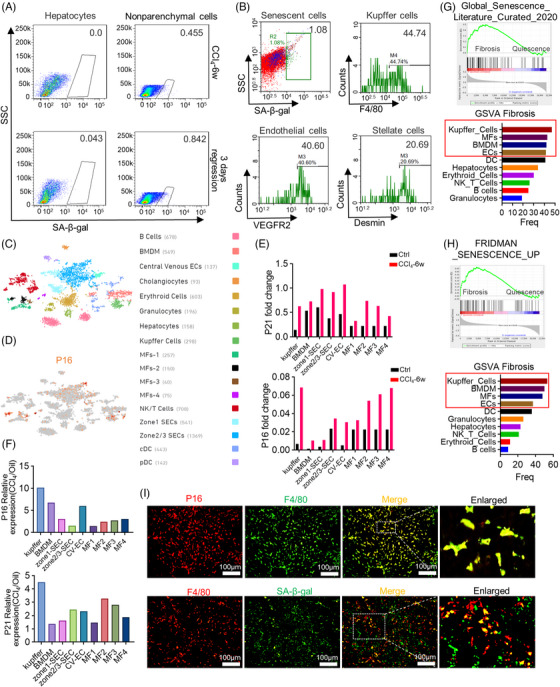
FIGURE 2.

Identification of the origin of senescent cells. (A) Single‐cell suspensions collected from hepatocytes or liver NPCs were analyzed by FCM 3 days after the withdrawal of CCl4; n = 1. (B) FCM analyses showed the proportion of KCs (F4/80), LSECs (VEGFR2), and HSCs (desmin) in senescent NPCs (SA‐β‐gal) on regression day 3. (C) tSNE (t‐distributed stochastic neighboring embedding) clustering representation of the distinct cell types of liver NPCs following CCl4 toxicity. (D) Gene expression of P16 was visualized by tSNE feature plots. (E and F) Fold change in expression of P16 and P21 observed in individual cell types by scRNA‐seq. (G and H) GSEA analyses with Global Senescence Literature Curated 2020 or Fridman Senescence UP in mice with CCl4 removal and control mice. GSVA enrichment score was performed for the above two senescence‐related gene sets of both experimental and control mice, bar graphs represented the frequency basis of positive cells in various NPC types by GSVA score. (I) IF co‐staining of P16 (red)/F4/80 (green) or SA‐β‐gal (green)/f4/80 (red) of livers on regression day 3. Scale bar: 100 μm. Bars = means ± SD; n = 3.
