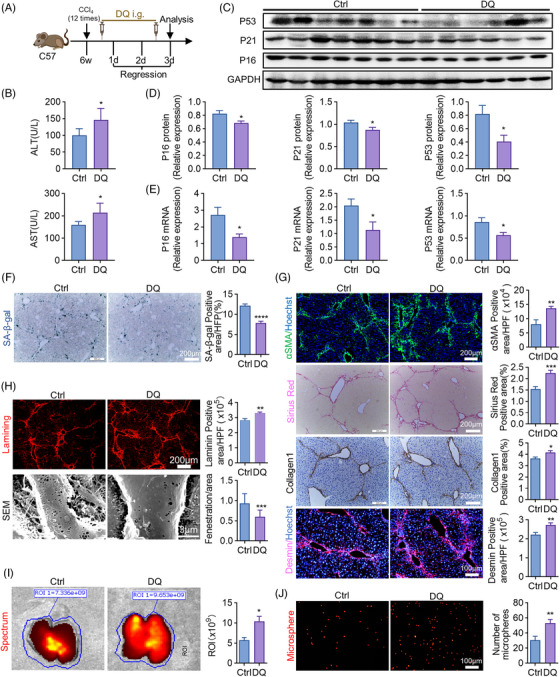
FIGURE 3.

Removing senescent cells inhibits liver fibrosis regression. (A) The strategy of DQ (dasatinib and quercetin) administration during the regression of liver fibrosis. All the experimental mice were sacrificed and analyzed on regression day 3. The cartoon was created by Photoshop. i.g. means oral gavage. (B) Detection of serum ALT, AST in DQ‐treated and control mice. (C) WB analyses of P16, P21, and P53 expressions in KCs of DQ‐treated and control mice; GAPDH served as an internal reference. (D) The quantification of (C). (E) The mRNA levels of P16, P21, and P53 were detected by RT‐qPCR in DQ‐treated and control mice; β‐actin was used as an internal reference. (F) Liver sections collected from DQ‐treated and control mice were stained by SA‐β‐gal staining kit. SA‐β‐gal‐positive cells were quantitatively compared. Scale bar: 200 μm. (G) IF (αSMA, Desmin) and IHC (Sirius red, Collagen1) staining of DQ‐treated and control mice. Positive areas were quantified and compared. Scale bar: 200 μm (αSMA, Sirius red, Collagen1), scale bar: 100 μm (desmin). (H) Staining of Laminin in DQ‐treated and control mice. Positive areas were quantitatively compared. Scale bar: 200 μm. Sinusoidal fenestrae were examined and quantitatively compared by SEM in DQ‐treated and control mice. Scale bar: 3 μm. (I and J) Red fluorescent microspheres injected into the spleen were subsequently observed in the liver. The fluorescence intensity was compared in (I) and the microspheres were quantified in (J). Scale bar: 100 μm. Bars = means ± SD; n = 6; *p < 0.05, **p < 0.01, ****p < 0.0001.
