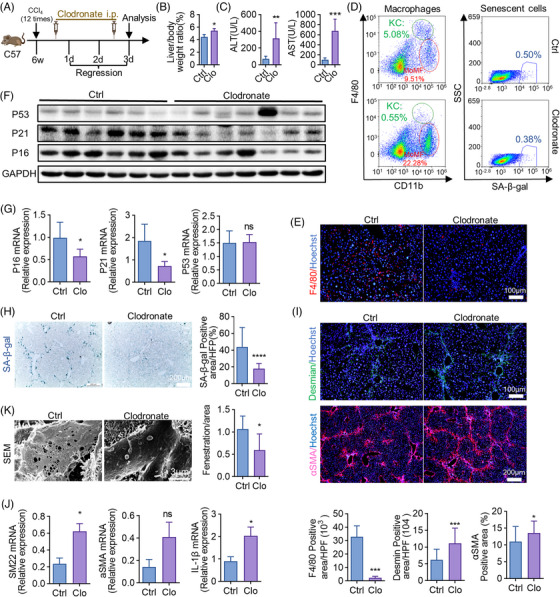
FIGURE 5.

Depletion of macrophages alleviates cellular senescence and impedes liver fibrosis regression. (A) The strategy of clodronate liposome injection. All the experimental mice were sacrificed and analyzed on regression day 3. i.p. = intraperitoneal injection. (B) Liver to bodyweight ratios were measured in clodronate liposome‐treated (Clo) and control mice. (C) Detection of serum ALT, AST levels in clodronate‐treated and control mice. (D) The proportion of SA‐β‐gal+ and F4/80+ CD11b+ in liver NPCs of clodronate‐treated and control mice was analyzed by FCM. (E) Anti‐F4/80 IF staining of livers collected from clodronate‐treated and control mice. F4/80‐positive cells were quantitatively compared. Scale bar: 100 μm. (F) Protein levels of P16, P21, and P53 in livers of clodronate‐treated and control mice were determined by WB; GAPDH served as an internal control. (G) The mRNA levels of P16, P21, and P53 were detected by RT‐qPCR in clodronate‐treated and control mice. (H) Staining of SA‐β‐gal. SA‐β‐gal‐positive cells were quantitatively compared. Scale bar: 200 μm. (I) IF staining and quantification of desmin and αSMA in livers of clodronate‐treated and control mice. Scale bar: 100 μm (desmin), scale bar: 200 μm (αSMA). (J) RT‐qPCR analyses of mRNA expressions of SM22, αSMA, and IL‐1β. (K) SEM analysis of liver sections collected from clodronate‐treated and control mice. Sinusoidal fenestrae were quantitatively compared. Scale bar: 3 μm. Bars = means ± SD; n = 4–7; *p < 0.05, **p < 0.01, ***p < 0.001; ns, not significant.
