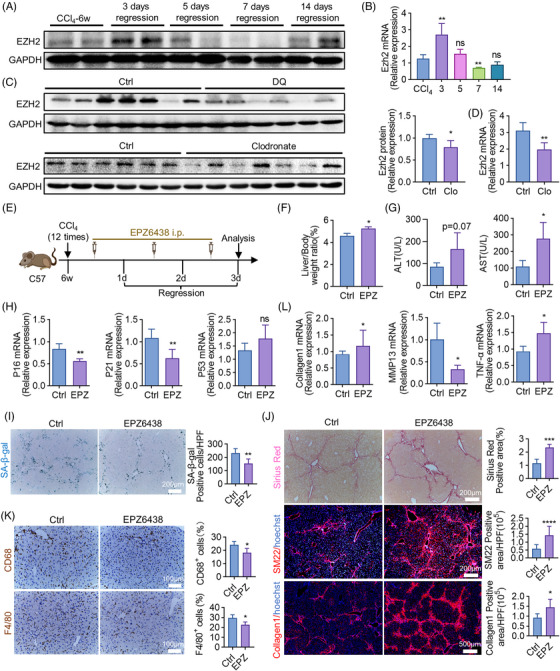
FIGURE 6.

EZH2 promotes cellular senescence and liver fibrosis regression. (A and B) Protein (A) and mRNA (B) levels of EZH2 in isolated macrophages at various time points during liver fibrosis regression; GAPDH and β‐actin served as internal controls. (C and D) Protein (C) and mRNA (D) levels of EZH2 in livers of DQ or clodronate‐treated and control mice on regression day 3. GAPDH and β‐actin served as internal controls. (E) The strategy of EPZ6438 administration. All the experimental mice were sacrificed and analyzed on regression day 3. (F) Liver to body weight ratios were detected in EPZ6438‐treated (EPZ) and control mice. (G) Detection of serum ALT, AST. (H) The mRNA levels of P16, P21, and P53 were detected by RT‐qPCR in EPZ6438‐treated and control mice. (I) Staining of SA‐β‐gal. SA‐β‐gal‐positive cells were quantitatively compared. Scale bar: 200 μm. (J) Sirius red and IF staining (SM22, Collagen1) of livers of EPZ6438‐treated and control mice. Positive areas were quantified and compared. Scale bar: 200 μm (Sirius red, SM22), scale bar: 500 μm (Collagen1). (K) Liver sections obtained from the EPZ6438‐treated or control group were analyzed using immunohistochemical staining with anti‐CD68 and anti‐F4/80. Scale bar: 100 μm. (L) RT‐qPCR analyses of Collagen1, MMP13 (matrix metallopeptidase 13), and TNF‐α (tumor necrosis factor α) in livers of EPZ6438‐treated and control mice. Bars = means ± SD; n = 5; *p < 0.05, **p < 0.01, ***p < 0.001, ****p < 0.0001; ns, not significant.
