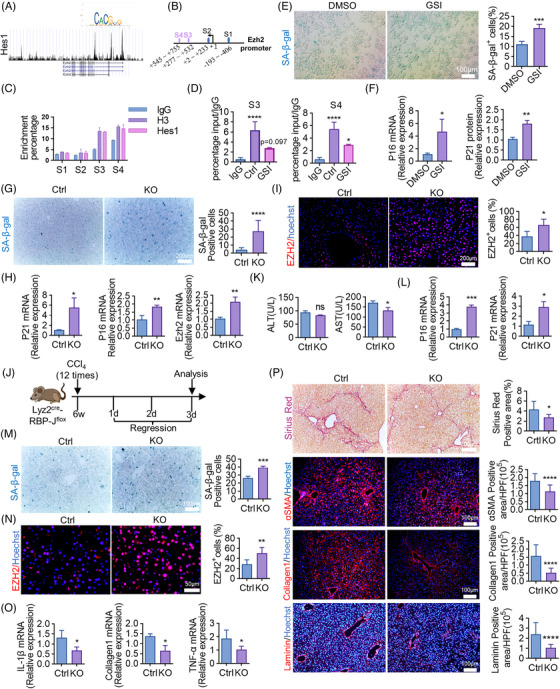
FIGURE 7.

Notch‐Hes1 impedes fibrosis regression by suppressing the transcription of EZH2. (A) Hes1 binding motif logo (https://jaspar.genereg.net/analysis). The relationship between promoter region of EZH2 and Hes1 was shown graphically by Cistrome Data Browser (http://cistrome.org/db/#/). (B) According to JASPAR database, EZH2 promoter region contains potential Hes1 binding sites. (C) Relative enrichment of EZH2 promoter sequences in control (IgG), positive control (H3), and Hes1 ChIPs in RAW264.7 cells. (D) Relative enrichment of EZH2 promoter sequences in control (IgG) and Hes1 ChIPs in RAW264.7 cells treated with GSI. (E) RAW264.7 cells were cultured in vitro and stained by SA‐β‐gal. SA‐β‐gal‐positive cells were quantitatively compared between GSI‐treated and DMSO control groups. Scale bar: 100 μm. (F) Relative mRNA expressions of P16 and P21 were determined in RAW264.7 cells treated with GSI or DMSO. (G) Liver sections collected from KO (Lyz2cre‐RBP‐Jf/f, homozygous) and control (Lyz2cre‐RBP‐Jf/+, heterozygous) mice were stained by SA‐β‐gal. SA‐β‐gal‐positive cells were quantitatively compared. Scale bar: 200 μm. (H) Relative mRNA expressions of P16, P21, and EZH2 were determined in KO and control mice. (I) IF staining of EZH2. EZH2‐positive cells were quantitatively compared. Scale bar: 100 μm. (J) The strategy of regression established in KO and control mice. All the experimental mice were sacrificed and analyzed on regression day 3. (K) Serum ALT, AST levels in KO and control mice. (L) Relative mRNA expressions of P16 and P21 were determined in KO and control mice. (M) SA‐β‐gal staining of livers of KO and control mice. SA‐β‐gal‐positive cells were quantitatively compared. Scale bar: 100 μm. (N) IF staining and quantification of EZH2 in livers of KO and control mice. Scale bar: 50 μm. (O) Relative mRNA expressions of IL‐1β, Collagen1, TNF‐α were determined in KO and control mice. (P) Sirius red, αSMA, Collagen1, and Laminin staining of livers of KO and control mice. Positive staining areas were quantitatively compared. Scale bar: 100 μm (αSMA, Collagen1, Laminin), scale bar: 200 μm (Sirius red). Bars = means ± SD; n = 2–4; *p < 0.05, **p < 0.01, ***p < 0.001, ****p < 0.0001.
