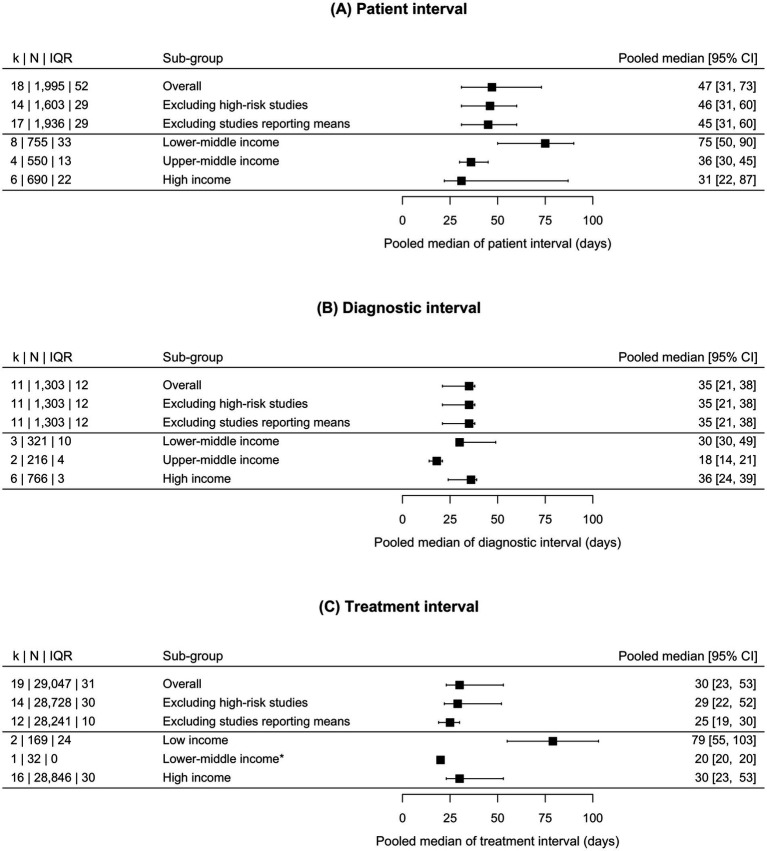
Figure 2.
Forest plot representing the pooled median duration and 95% confidence intervals for the patient (A), diagnostic (B), and treatment (C) intervals in oral cancer. The asterisk (*) represents a median obtained from only one study, which prevented an estimation of the confidence interval. CI, confidence interval; IQR, interquartile range. k: number of studies or, alternatively, number of groups of patients in whom an interval duration was measured (e.g., a study may have reported the duration of the treatment interval for women and men separately). N: number of patients with available information on each interval’s duration.

