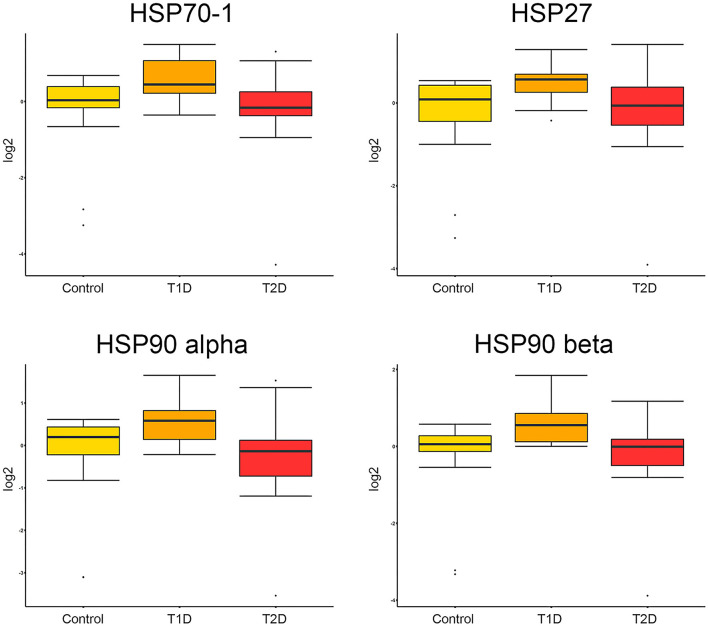
Figure 1.
Boxplots of protein intensities. Protein intensities, log2-transformed and normalized of HSP70-1/HSP72, HSP27, HSP90-alpha, and HSP90 beta are presented as boxplots for each group of subjects. No statistically significant differences were found for any of the proteins above in the linear regression model when p-values were adjusted for multiple comparisons (Supplementary Table 1).

