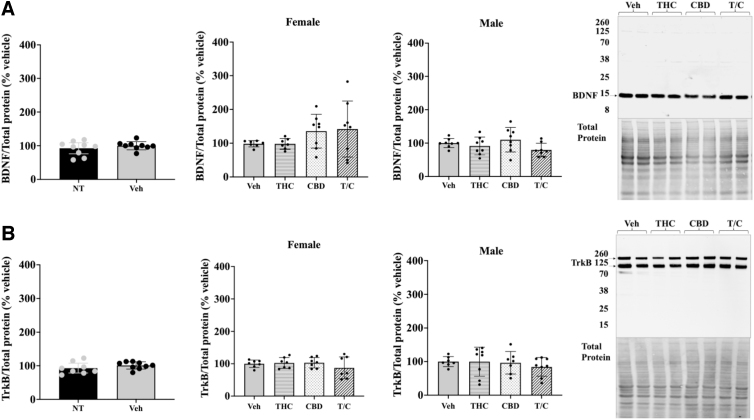
FIG. 3.
Quantitation of BDNF and TrkB receptor protein in the hippocampus using western blot analysis. (A) BDNF analysis. (B) TrkB receptor western analysis. Comparison between NT and vehicle-treated mice for BDNF and TrkB receptor (female and male data combined; left). Protein expression of treated female and male mice relative to vehicle (middle graphs). Representative western blots and corresponding total protein images for BDNF and TrkB (right). T/C stands for THC and CBD. A one-way ANOVA with multiple comparisons and Tukey's post hoc test were used to determine differences with a p-value set to 0.05 for statistical significance. No differences were observed between groups, n=7–8. Error bars represent 95% confidence interval. NT, nontreated.

