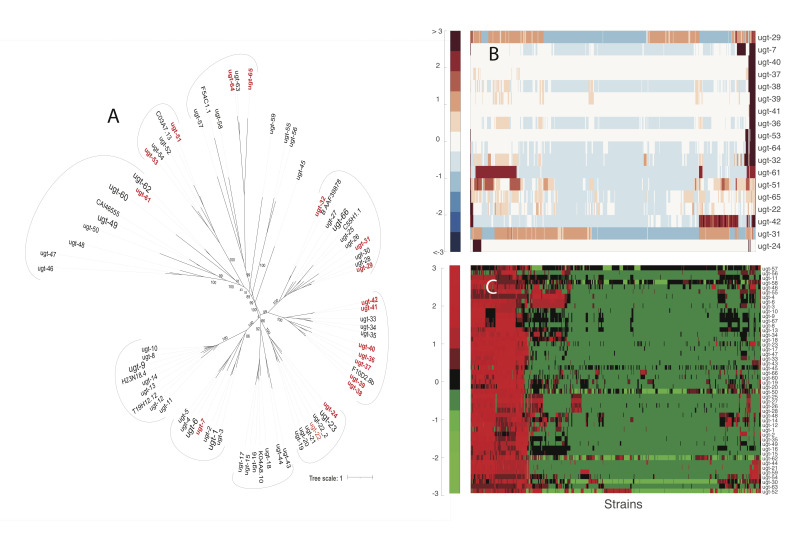
Figure 1. ugt variation in C. elegans .
A : Phylogenetic tree of the known UGTs in C. elegans . The hyper-divergent UGTs are enlarged and highlighted in red. B : Hierarchical cluster of the known hyper-divergent ugt genes. A heatmap of the z-score of the variation is plotted. C : Hierarchical cluster of the non-hyper-divergent ugt genes. A heatmap of the z-score of the variation is plotted.

