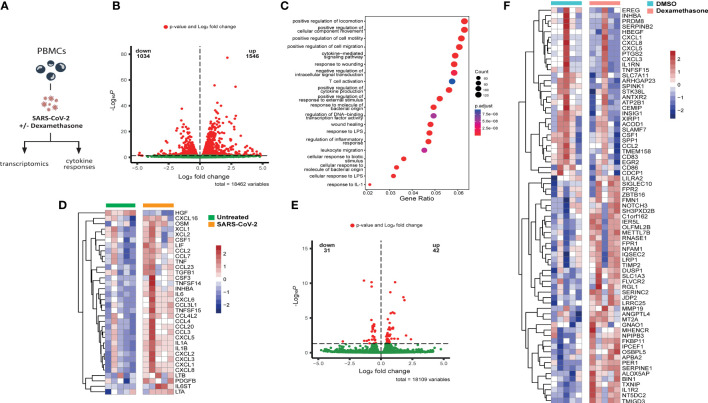
Figure 1.
Dexamethasone alters the transcriptome of SARS-CoV-2 stimulated PBMCs in vitro. (A) Experimental in vitro setup for profiling the transcriptome and cytokine responses of PBMCs derived from healthy individuals stimulated with heat-inactivated SARS-CoV-2 in the absence (vehicle control DMSO) or presence of dexamethasone. (B) Volcano plot depicting the distribution of the adjusted P values (-Log10 P) and the fold changes (Log2 fold change) of differentially expressed genes in heat-inactivated SARS-CoV-2-treated PBMCs as compared to unstimulated cells 4h after exposure. Significantly altered genes are colored red (n=5 healthy individuals; FDR < 0.05). (C) Gene set enrichment analysis of top altered pathways in heat-inactivated SARS-CoV-2-treated PBMCs, as compared to unstimulated cells 4h after exposure. The counts indicate the total number of DEGs in the enriched pathway, whereas the color indicates the P value (n=5 healthy individuals; FDR < 0.05).(D) Heatmap showing statistically significant differentially expressed cytokine transcripts in PBMCs stimulated with heat-inactivated SARS-CoV-2, as compared to unstimulated cells 4h after exposure. Colors indicate the z-scores calculated per gene from the Log2 normalized counts (n=5 healthy individuals; red increased, blue decreased; FDR < 0.05). (E) Volcano plot depicting the distribution of the adjusted P values (-Log10 P) and the fold changes (Log2 fold change) of differentially expressed genes in heat-inactivated SARS-CoV-2-treated PBMCs as compared to cells treated with dexamethasone (10nM) 4h after exposure. Significantly altered genes are colored red (n=5 healthy individuals; FDR < 0.05). (F) Heatmap showing differentially expressed genes between untreated (DMSO) or dexamethasone (10nM)-treated PBMCs stimulated with heat-inactivated SARS-CoV-2 for 4h. Colors indicate the z-scores calculated per gene from the Log2 normalized counts (n=5 healthy individuals; red increased, blue decreased; FDR < 0.05).

