Figure 3.
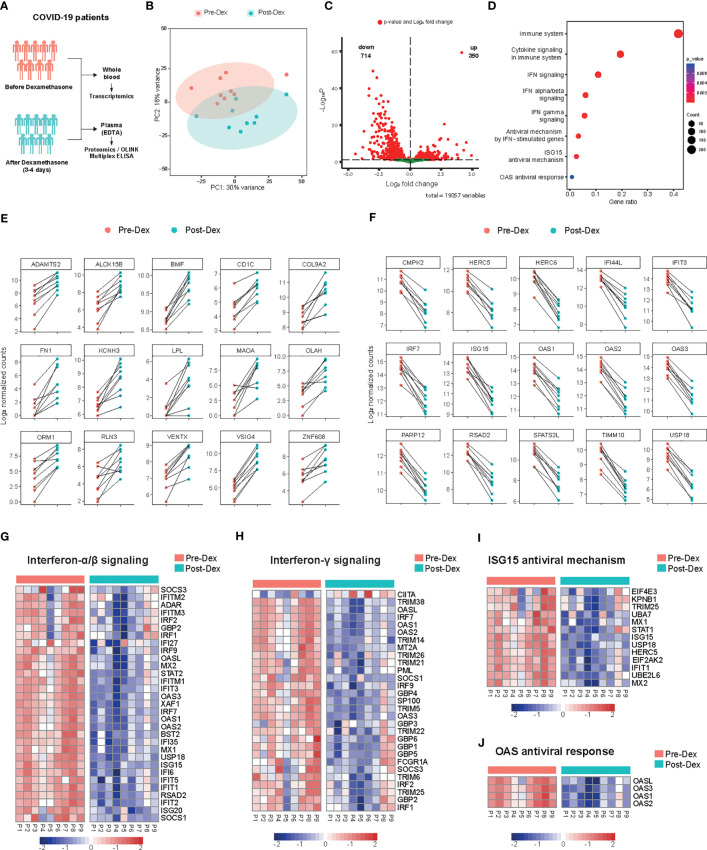
Whole blood transcriptome profile before and after dexamethasone treatment in hospitalized COVID-19 patients. (A) Schematic presentation of the study design. COVID-19 patients eligible for dexamethasone treatment were analyzed before and 3-4 days after starting dexamethasone treatment (n=9 COVID-19 patients). (B) Principal component analysis (PCA) plot of whole blood expressed genes in COVID-19 patients before (Pre-Dex) and after dexamethasone treatment (Post-Dex). The ellipses indicate the 95% confidence intervals (CI). (C) Volcano plot depicting the distribution of the adjusted P values (-Log10 P) and the fold changes (Log2 fold change) of whole blood DEGs in COVID-19 patients before and after dexamethasone treatment. Significantly altered genes are colored red (FDR < 0.05). (D) Gene set enrichment analysis of top altered pathways in whole blood transcriptome before versus after dexamethasone treatment. The counts indicate the total number of DEGs in the enriched pathway, whereas the color indicates the P value (FDR < 0.05). (E) Top 15 significantly upregulated protein-coding genes in whole blood transcriptome before versus after dexamethasone treatment. The y-axis indicates the Log2 normalized counts. (F) Top 15 significantly downregulated protein-coding genes in whole blood before versus after dexamethasone treatment. The y-axis indicates the Log2 normalized counts. (G-J) Heatmaps showing differentially expressed genes after dexamethasone treatment of IFN α/β signaling (P value = 1.41·10-20) (G), IFN-γ signaling (P value = 6.42·10−15) (H), ISG15 antiviral mechanism (P value = 7.42·10−04) (I), or OAS antiviral response (P value = 7.95·10−03) (J). Row scaling has been applied to each row (gene). The colors indicate the z-scores from the Log2 normalized counts (red increased, blue decreased; FDR < 0.05).

