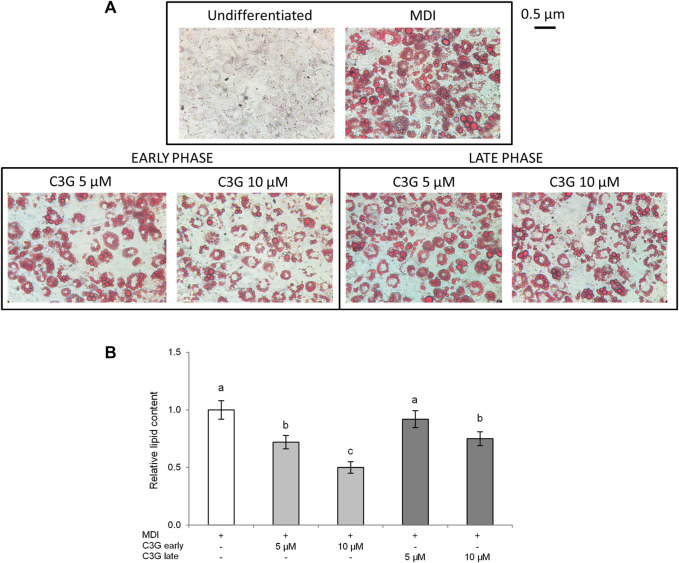
FIGURE 2.
C3G effect on lipid accumulation in 3T3-L1 cells treated in early or late phase. (A) Staining with Oil Red O (magnification at × 40). Representative images of four separate experiments. (B) Lipids were extracted by using isopropanol and expressed as relative content vs. CTR cells. All data are expressed as mean ± SD of four independent experiments (n = 4) each in triplicate. Means with the same letter are not significantly different from each other (p > 0.05).

