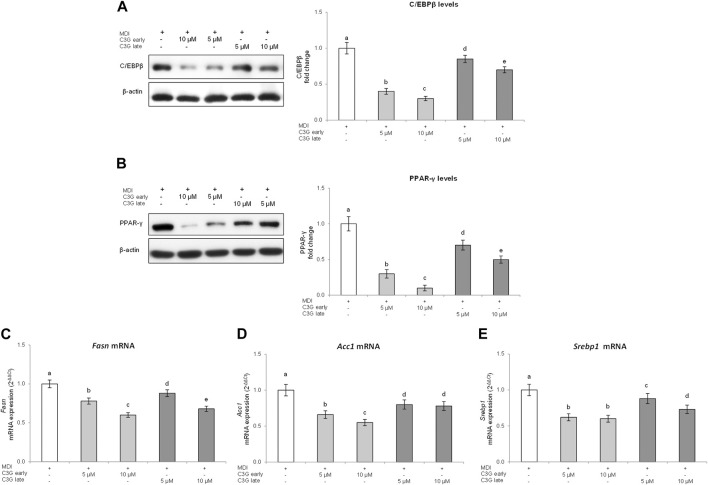
FIGURE 3.
C3G effects on C/EBPβ (A) and PPAR-γ (B) protein levels, and on Fasn (C), Acc1 (D) and Srebp1 (E) gene expression in 3T3-L1 cells treated in early or late phase. (A,B) Representative images from four independent experiments. Densitometry data are expressed as fold change vs. MDI control. The order of histogram bars was rearranged for illustrative purposes. (C) Fasn, Acc1 and Srebp1 mRNA expression levels were analyzed by real time PCR. All data are expressed as mean ± SD of four independent experiments (n = 4) each performed in triplicate. Means with the same letter are not significantly different from each other (p > 0.05).

