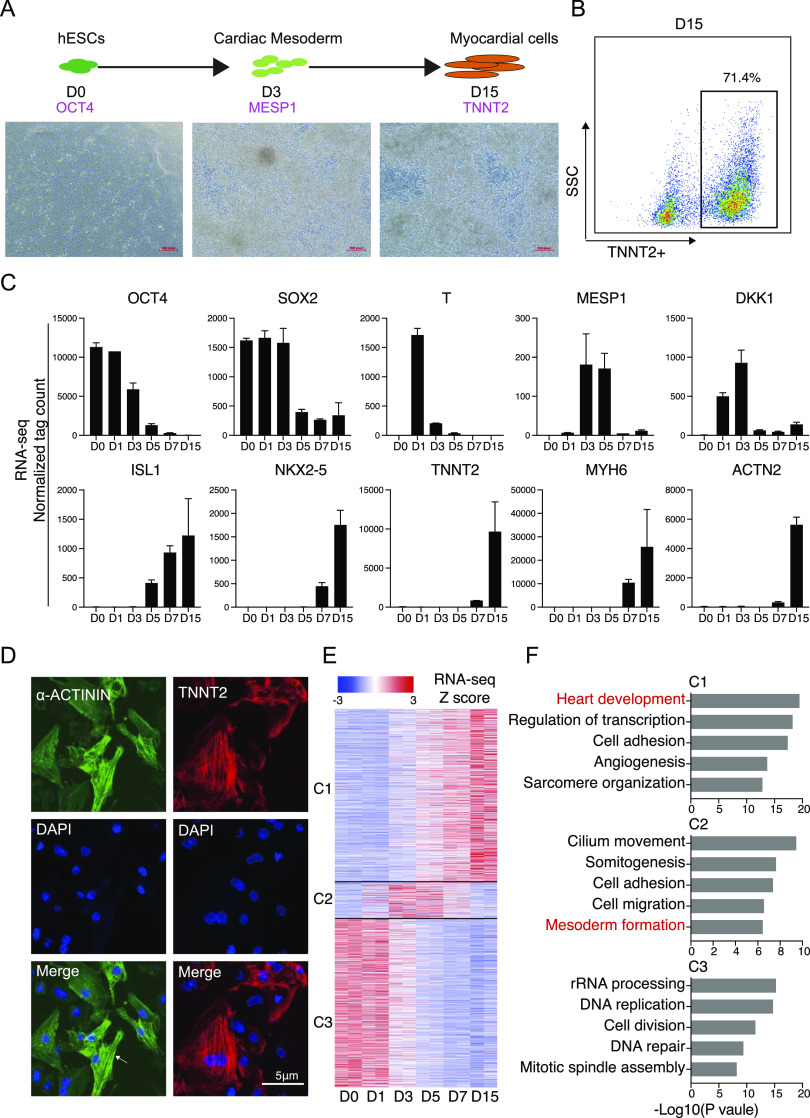
Figure 1. Induction of human embryonic stem cells (hESC) differentiated into cardiomyocytes.
(A) Schematic for cardiomyocyte generation from human embryonic stem cells. Below is the cell morphology at different stages; D, day. (B) Flow cytometry quantification of cardiomyocyte differentiation efficiency according to the GiWi method (21). (C) RNA-seq data showing the expression profile of representative genes during hESC-to-cardiomyocyte differentiation. Data were from two replicates and are shown as the mean. (D) Immunostaining showed protein expression of the cardiomyocyte marker genes TNNT2 and α-ACTININ. Scale bar, 5 μm. The white arrow point to a sarcomere. (E) Heatmap shows the difference expressed genes during cardiomyocyte generation. According to the expression profile, genes expressing from low to high (C1, 2586) and high in the middle stage (C2, 519) and from high to low (C3, 2506) were clustered together. (F) Gene ontology analysis shows the different biology functions of the genes in C1∼C3 category.

