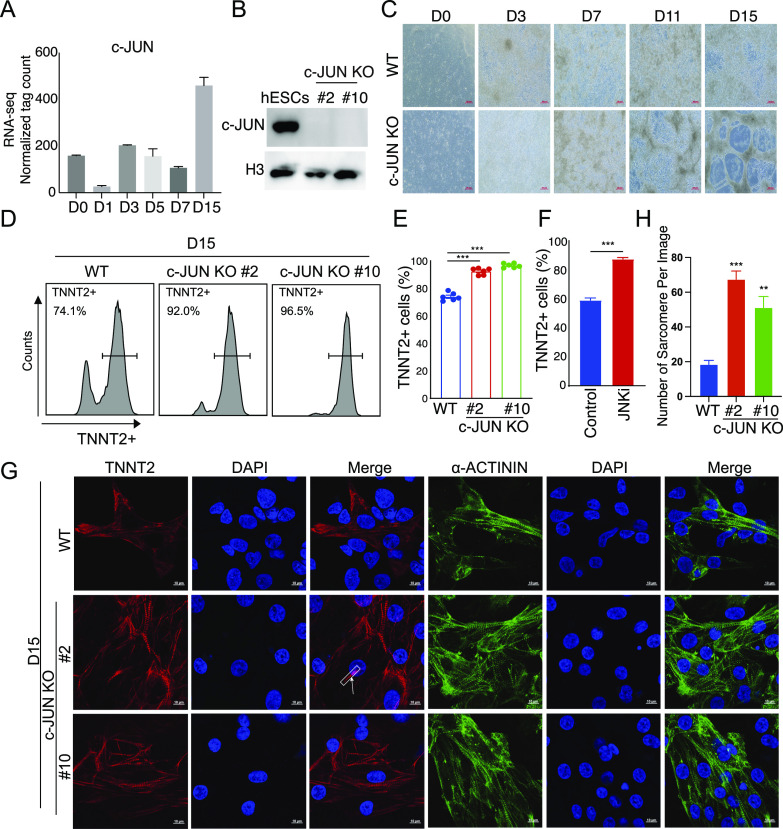
Figure 2. c-JUN is a barrier in cardiomyocyte differentiation.
(A) Bar plot shows c-JUN expression pattern during cardiomyocyte generation. Data were from two replicates and shown as the mean ± SEM; D, day. (B) Western blot for c-JUN in WT and c-JUN knockout hESC clones. (C) Morphology of cardiomyocytes differentiated from WT and c-JUN knockout hESC. D, day; Scale bars, 200 μm. (D) Flow cytometry analysis of TNNT2 expression in cardiomyocytes differentiated from hESC. Percent of cell TNNT2+ is indicated at each condition; WT, induce cardiomyocytes from WT hESC; c-JUN KO, induce cardiomyocytes from c-JUN knockout hESC; D, day. (D, E) Flow cytometry quantification of differentiation efficiency from (panel (D)). Knockout of c-JUN enhances the number of TNNT2+ cells on D15 of the cardiomyocyte differentiation. Data were from six biological replicates in three independent experiments and are shown as the mean ± SEM. *** P-value < 0.001, two-way ANOVA with Sidak correction between the WT control and c-JUN KO groups. (F) Flow cytometry quantification of cardiomyocyte differentiation efficiency with or without JNK inhibitor (SP600125, 2 μm). JNKi was added to the culture medium from D0 to D15. Data were from seven biological replicates in two independent experiments and are shown as the mean ± SEM. *** P-value < 0.001, two-way ANOVA with Sidak correction between the control (DMSO) and JNK inhibitor groups. (G) Immunostaining showing knockout c-JUN promotes expression of cardiomyocyte marker genes TNNT2 and α-ACTININ. Scale bar, 10 μm. The white box marks a sarcomere. (H) Counts of the number of sarcomeres in each image. Data were from four to six replicates and are shown as the mean ± SEM. *** P-value < 0.001, ** P-value < 0.01, two-way ANOVA with Sidak correction between the WT and c-JUN KO groups.
Source data are available for this figure.

