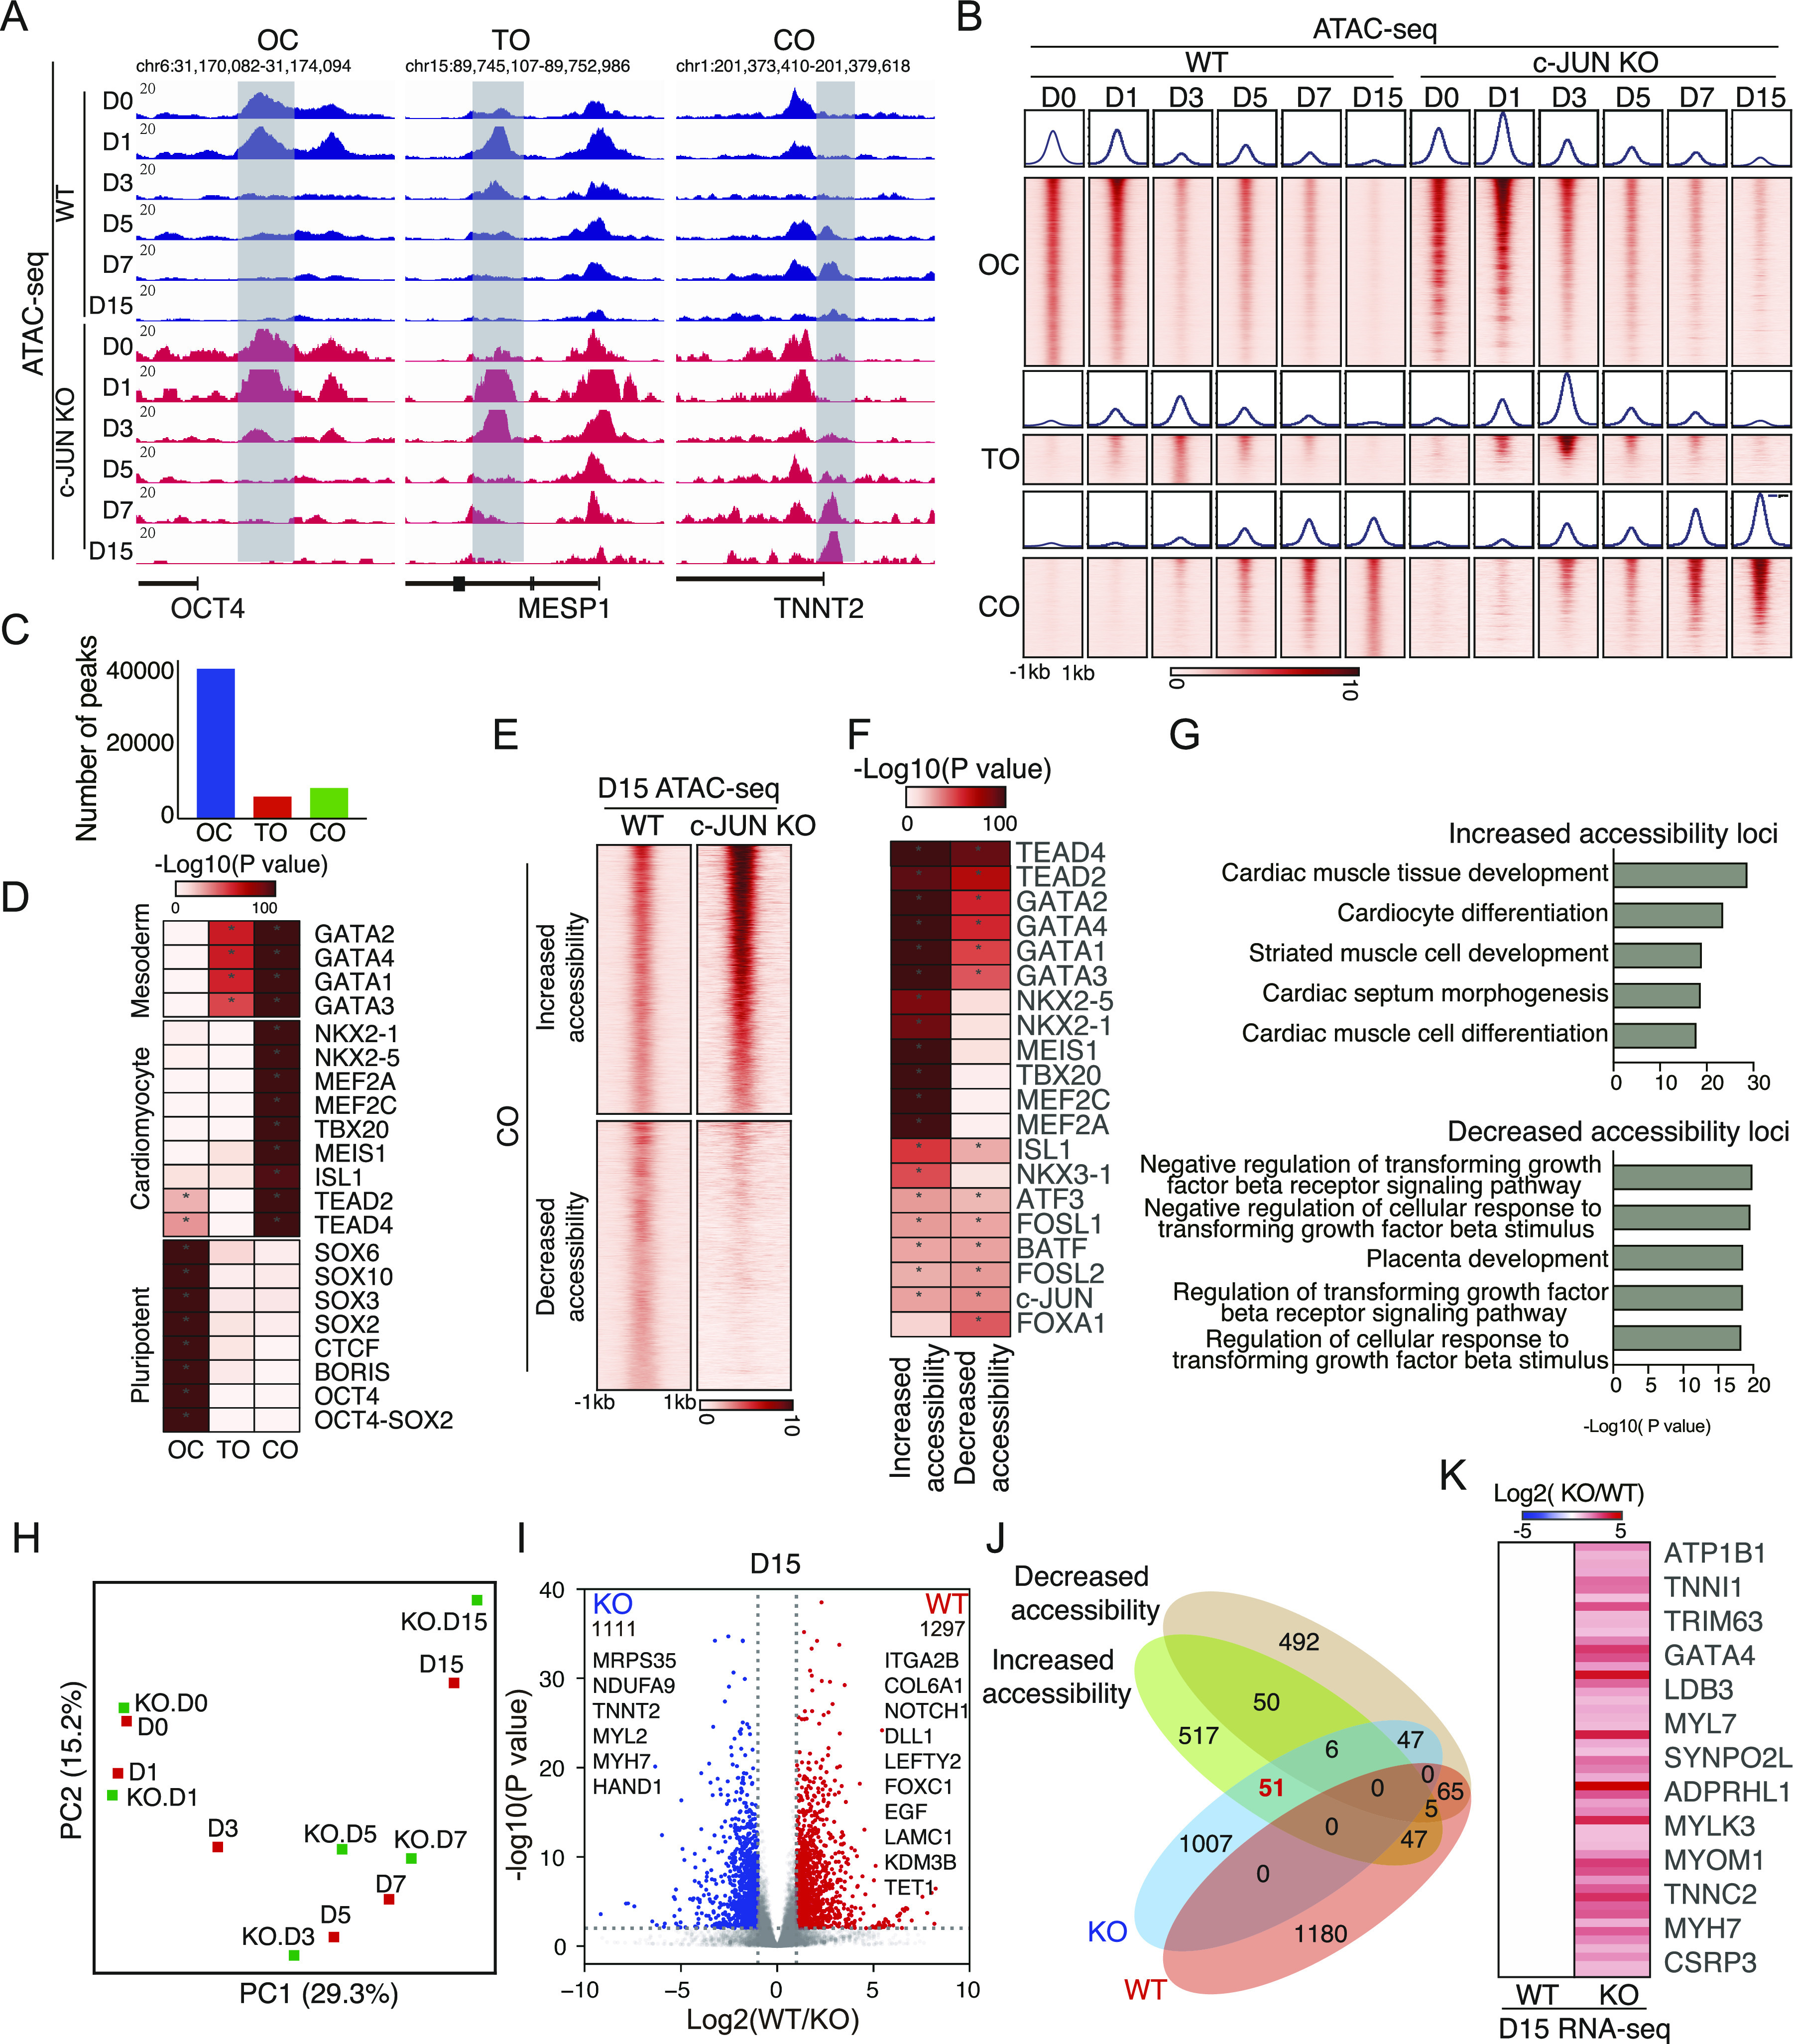
Figure 3. c-JUN regulates chromatin opening during cardiomyocyte differentiation.

(A) Genome view of the ATAC-seq data for Open to Close (OC), Transition Open (TO), and Close to Open (CO), represented by the pluripotent gene OCT4, mesoderm gene MESP1, and cardiomyocyte marker gene TNNT2. (B) Heatmap and pileup showing the ATAC-seq chromatin accessibility for D0 to D15 cells at OC/TO/CO loci. The heatmap and pileups are centered on the ATAC-seq peaks center. (C) Number of peaks in each OC/TO/CO category. (D) TF motifs significantly enriched at least > 1.5-fold for OC/TO/CO categories of ATAC-seq peaks. * Indicates a P-value < 1e-20. (E) Heatmap showing knockout c-JUN promotes half of the CO loci more accessibility (Increased accessibility) and closed half of the CO loci (Decreased accessibility). (E, F) TF motifs were significantly enriched at least > 1.5-fold for Increased and Decreased loci as defined in panel (E). * Indicates a P-value < 1e-20. (G) Gene ontology (GO) analysis of the significantly enriched biological process terms related to Increased accessibility and Decreased accessibility loci. (H) Principal component analysis of the time courses of gene expression of cardiomyocytes generated from WT and c-JUN knockout hESC. (I) Volcano plot showing the differentially expressed genes on Day 15 (D15) cardiomyocytes generated from WT and c-JUN KO hESC. (I, J) Venn diagram showing the overlap of genes regulated by Increased and Decreased loci with differentially expressed genes (defined in (I)) in WT and c-JUN KO cells. (J, K) Heatmap showing the fold-change of gene expression of the 51 genes defined in panel (J).
