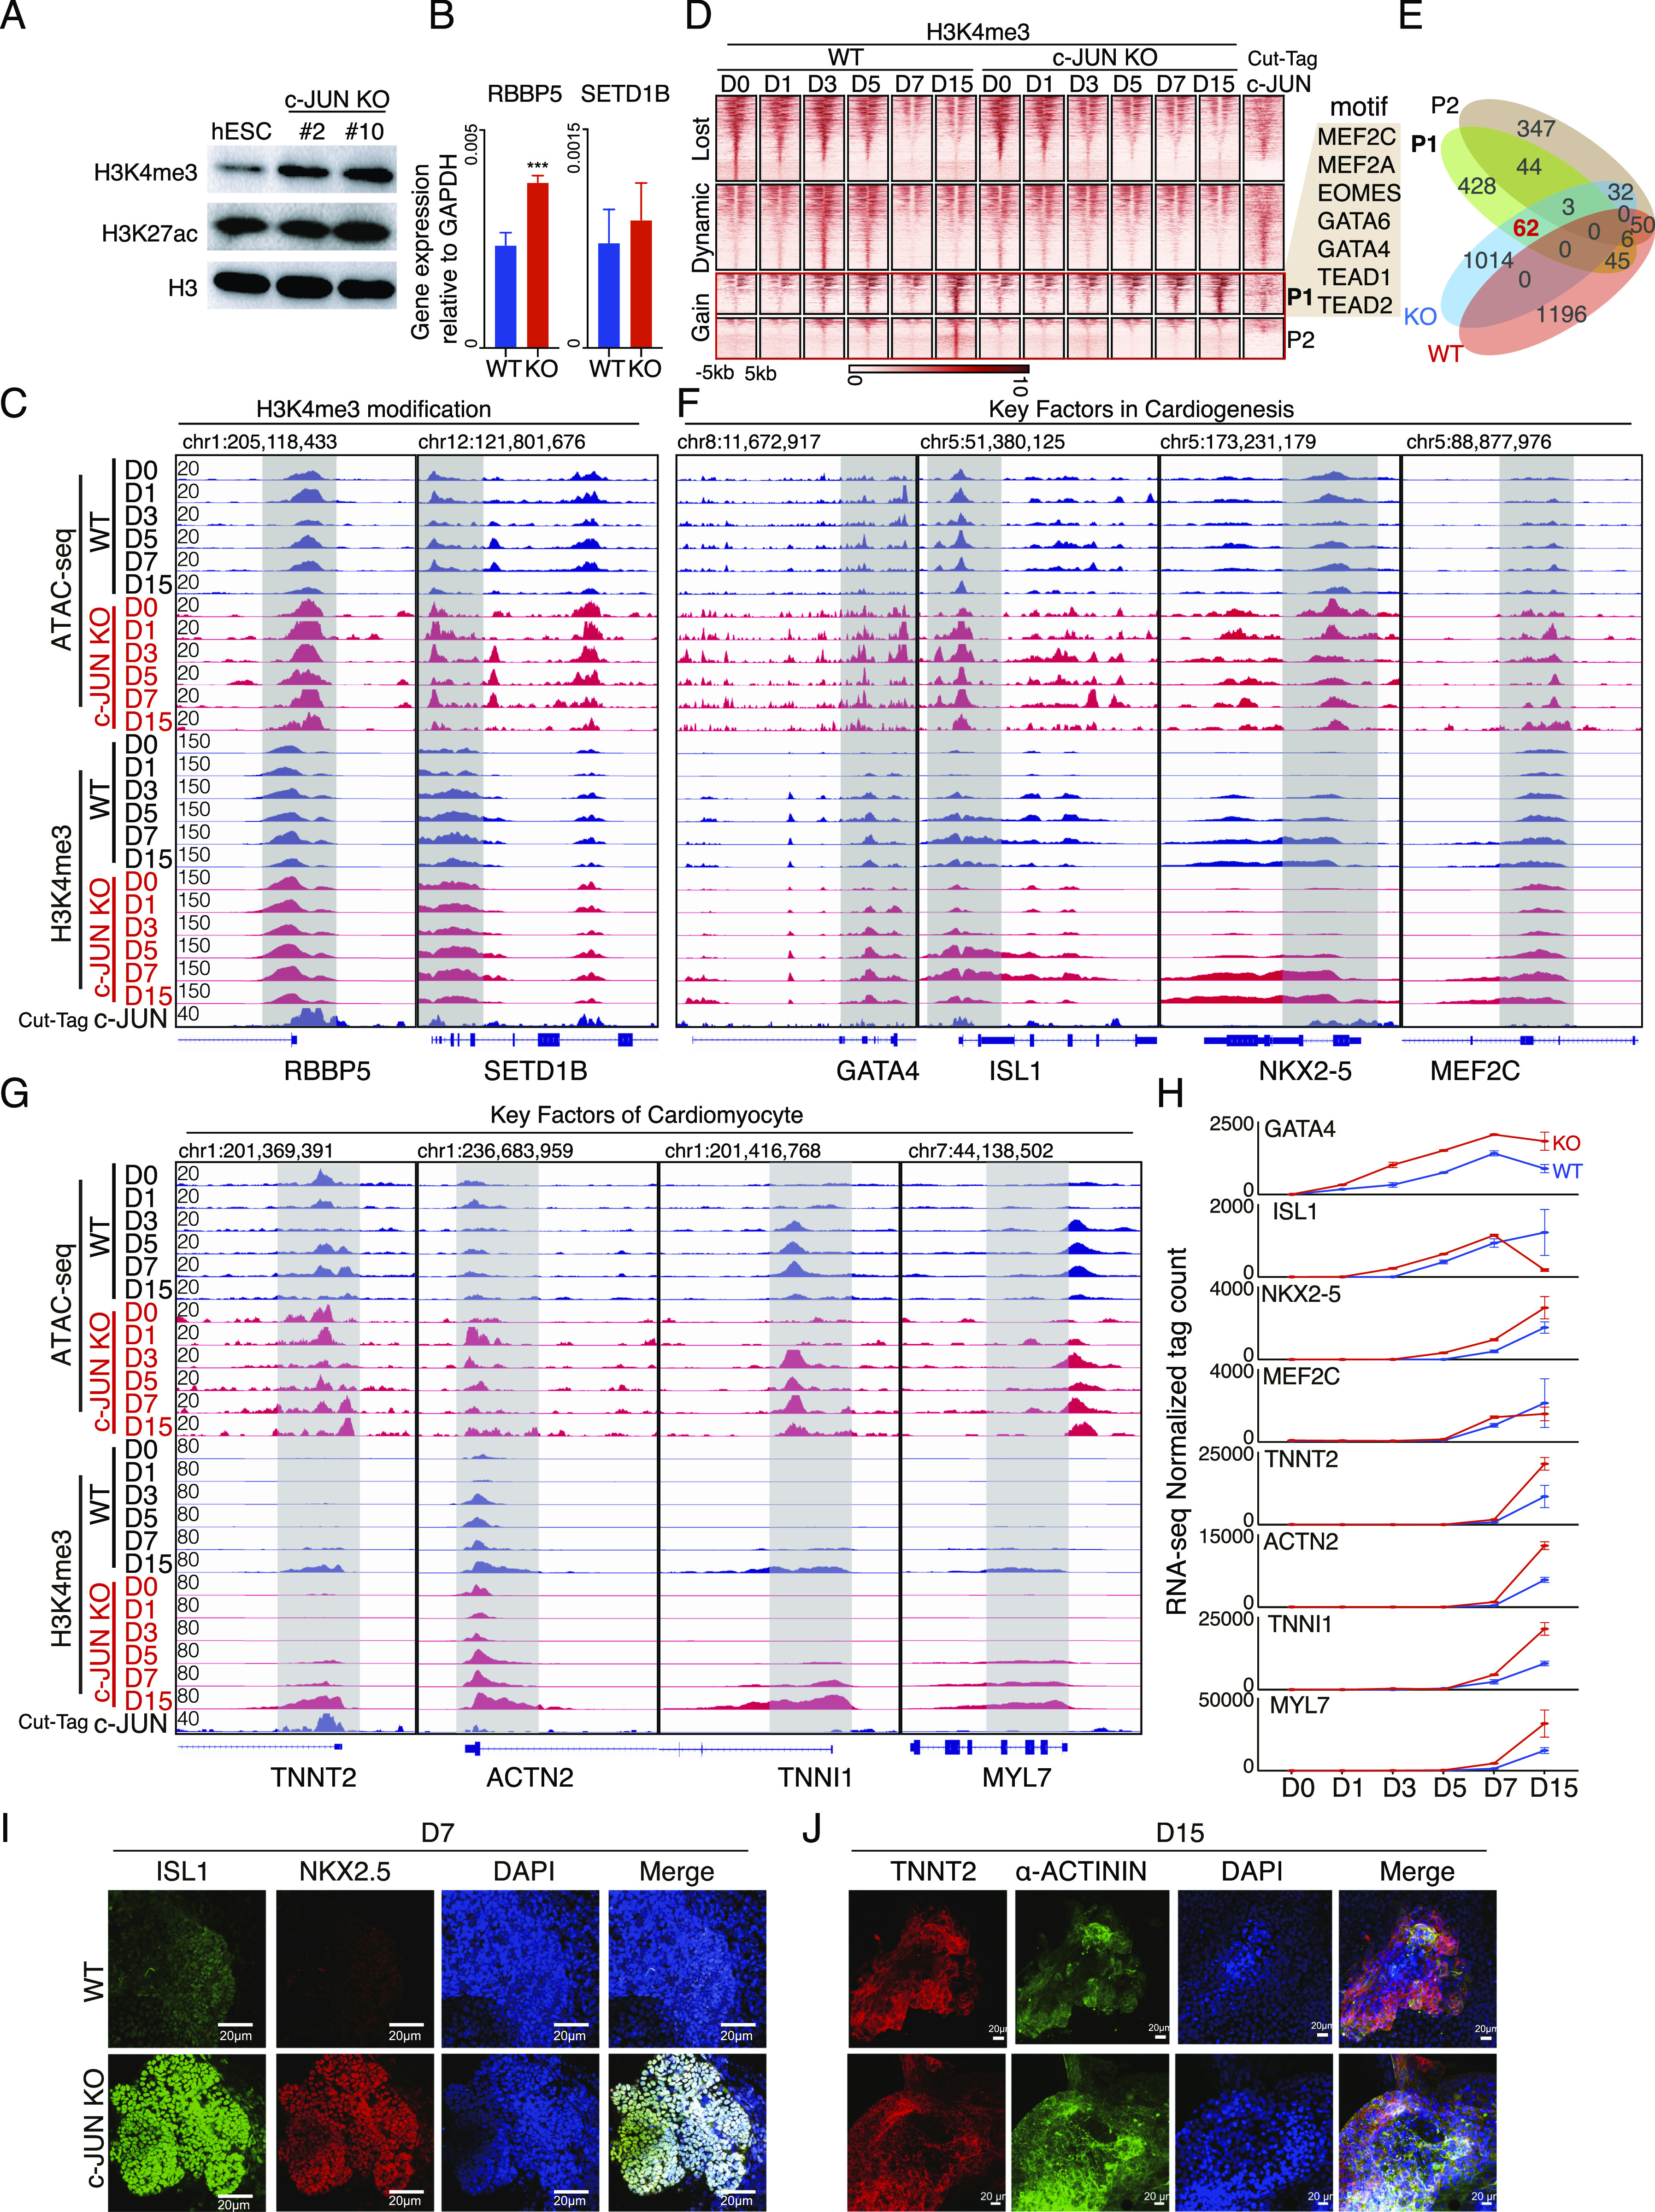
Figure 4. c-JUN inhibits H3K4me3 modification during cardiomyocyte generation.
(A) Western blot showing the levels of H3K4me3 and H3K27ac in WT and knockout c-JUN hESC. (B) Relative expression of the indicated SET complex genes in WT and c-JUN KO hESC. Data were from eight biological replicates in four independent experiments and are shown as the mean ± SEM. *** P-value < 0.001, Unpaired t test between the WT and KO (c-JUN KO) groups. (C) Genome view of the ATAC-seq data, H3K4me3 ChIP-seq, and c-JUN CUT&Tag data at the SET complex genes RBBP5 and SETD1B loci. (D) Heatmap showing the read density for H3K4me3 ChIP-seq data during the time course of WT and c-JUN KO hESC differentiation into cardiomyocytes. c-JUN binding profile was generated from hESC by CUT&Tag. The data were arranged into Lost, Dynamic, and Gain categories, based on the behavior of H3K4me3 in WT cells. When overlapped with c-JUN KO data, the Gain H3K4me3 loci were further subdivided into P1 and P2 subgroups. P1 loci have H3K4me3 modification in both WT and c-JUN KO cells. P2 loci have no H3K4me3 modification in c-JUN KO cells. (E) Venn diagram showing the overlap of genes regulated by P1 and P2 loci with DEGs (defined in Fig 3I) in WT and c-JUN KO cells. (F) Genome view of the ATAC-seq data, H3K4me3 ChIP-seq, and c-JUN binding data for the key factors in cardiogenesis. (G) Genome view of the ATAC-seq data, H3K4me3 ChIP-seq, and c-JUN binding data for the key factors of cardiomyocytes. (H) The RNA expression pattern for the respective genes is shown in line plot. RNA-seq expression units are normalized tag counts. (I, J) Immunostaining showing the protein levels of the cardiac progenitor marker genes ISL1 and NKX2-5 (panel (I)) and cardiomyocyte marker genes TNNT2 and α-ACTININ (panel (J)). Scale bar, 20 μm.
Source data are available for this figure.

