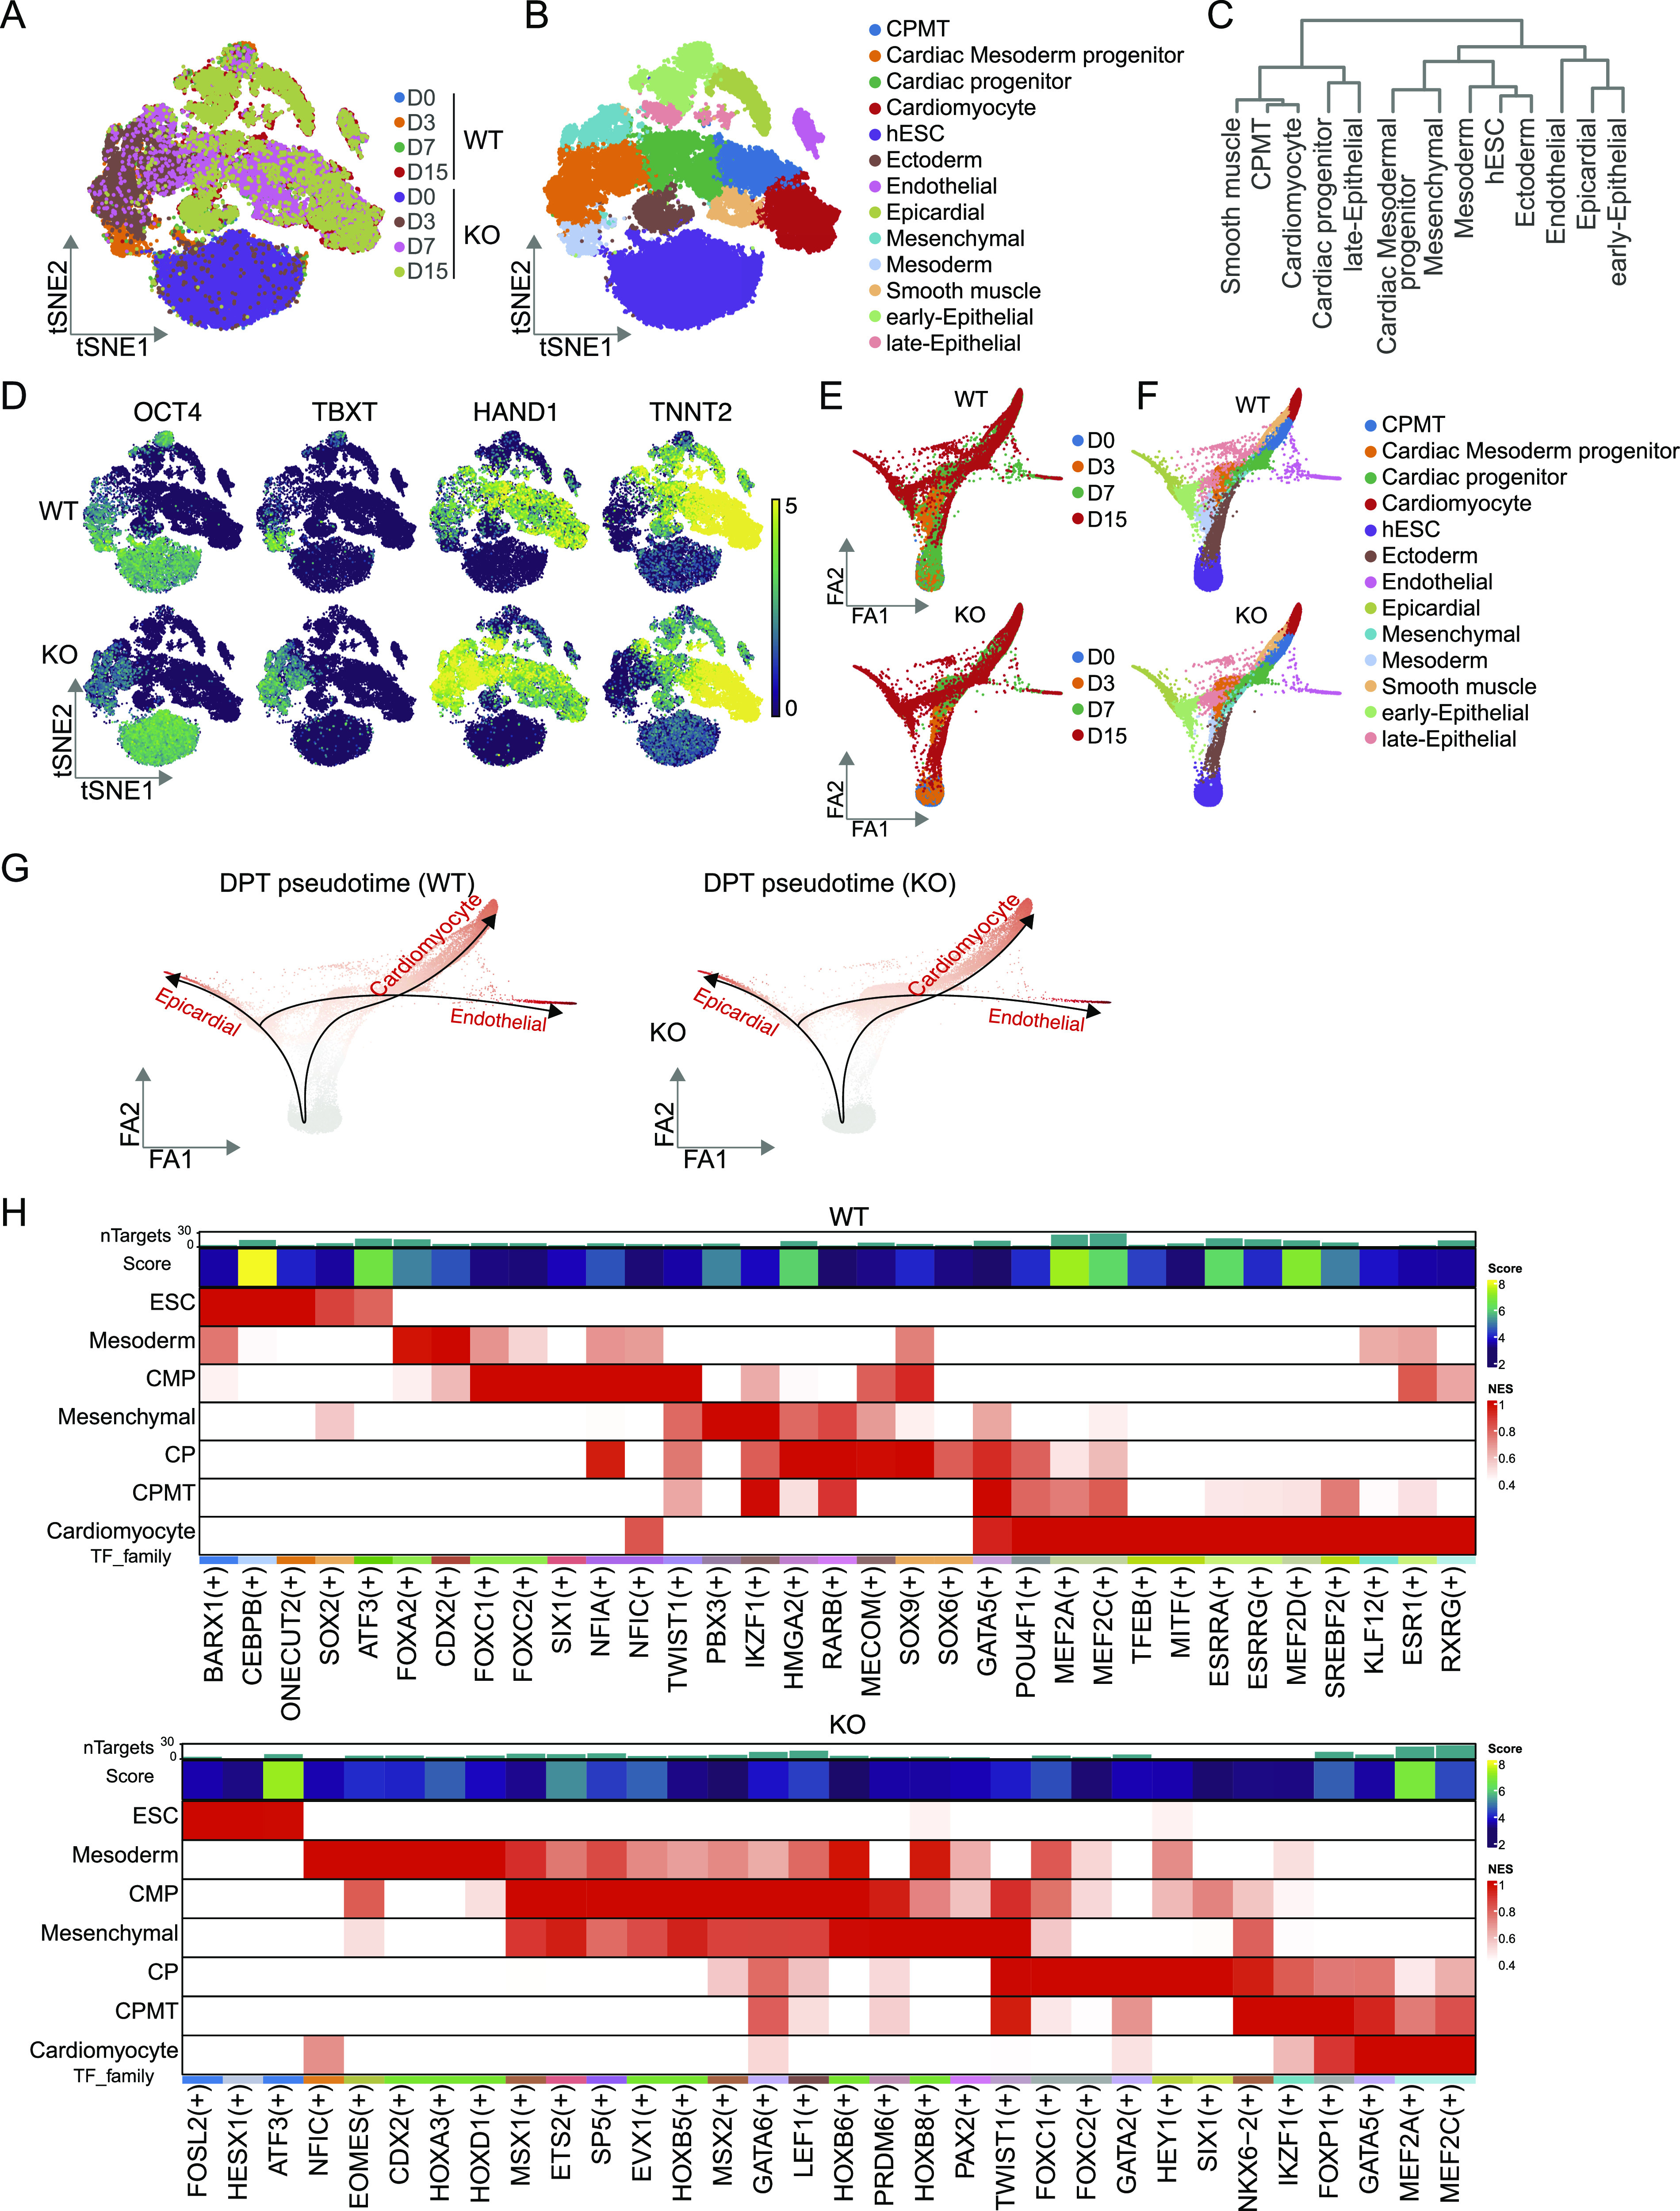
Figure 6. Single-cell transcriptome analysis showing the trajectories of cardiomyocyte differentiation.

(A, B) A t-SNE showing the single-cell RNA-seq data of WT and c-JUN KO cells during hESC differentiation into cardiomyocytes. (B) 13 cell clusters were defined according to the specific marker genes. (C) Dendrogram plot shows the correlation of the 13 cell clusters. (D) t-SNE colored by the expression level of representative marker genes during the induction of hESC into cardiomyocytes. Each dot represents one cell, and RNA level is colored by selected marker intensities from high (yellow) to low (purple). (E, F) Cell differentiation trajectory calculated using the ForceAtlas2 algorithm. (E, F) WT and c-JUN KO cells are shown in separated plots (E) based on time and (F) based on the cell types. (G) Diffusion pseudotime shows the differentiation trajectory of WT and c-JUN KO cells. (H) SCENIC results on the WT and c-JUN KO condition, master regulators are color-matched with the cell types.
