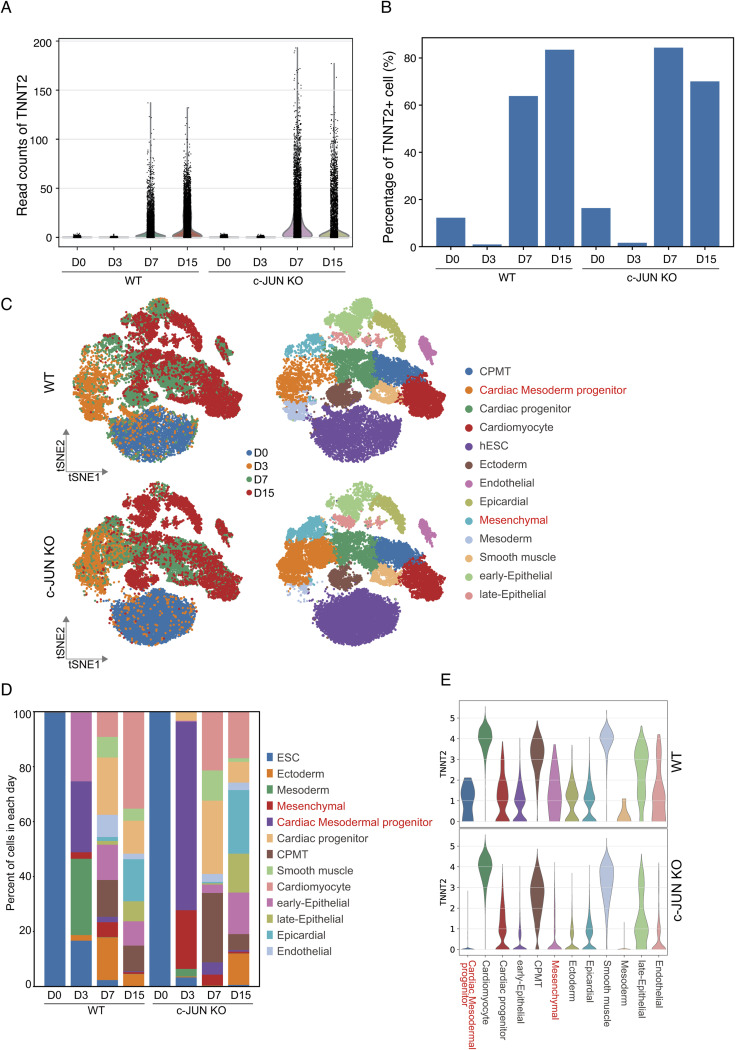
Figure S3. Single-cell RNA-seq illustrates cell dynamics during hESC-to-cardiomyocyte differentiation.
(A) Single-cell RNA-seq data shows read count of TNNT2 during hESC-to-cardiomyocyte transition between WT and c-JUN KO cells. (B) Percentage of TNNT2+ cell in D0-D15 between WT and c-JUN KO cells. (C) t-SNE map shows the cell distribution of WT and c-JUN KO conditions. (D) Percentage of each cell type in each day during hESC-to-cardiomyocyte transition. (E) Violin plot shows the expression of TNNT2 in each cell type in D15.

