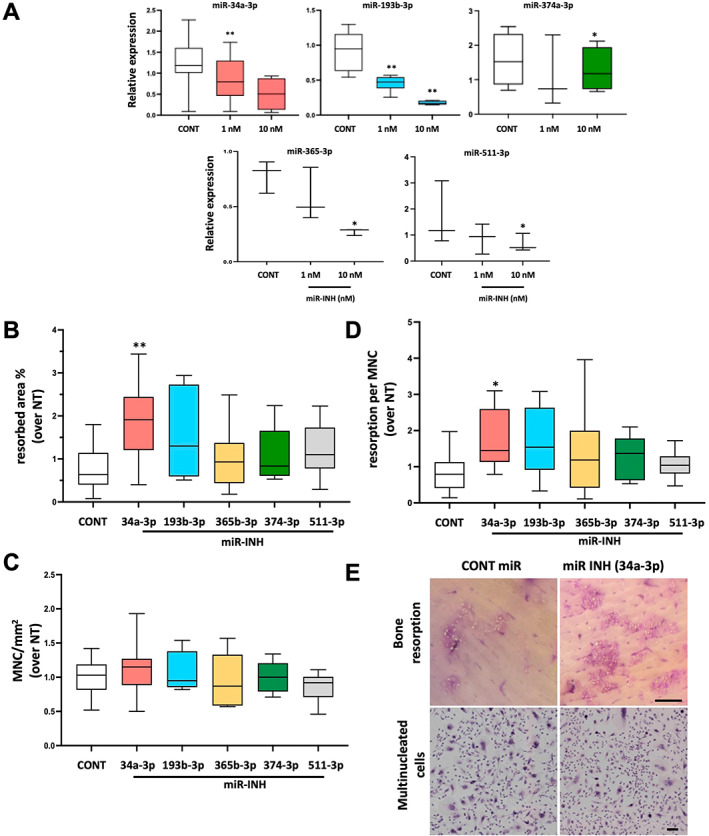
Fig. 3.

Impact of microRNA (miR) inhibition on osteoclasts. Cord blood monocyte (CBM)‐derived osteoclast cultures were either nontransfected (NT) or transfected with antagomirs (1 or 10 nM) (miR‐INH) or with a negative control (Cont) on day 14 for 48 hours; miR expression is represented graphically. (A) RT‐qPCR after miRNA transfection to validate antagomir transfection in mature osteoclasts. Relative expression levels of miR‐34a‐3p, 193b‐3p, 365b‐3p, 374a‐3p, and 511‐3p after inhibition with an antagomir are presented (boxplot: median, min–max, n = 3–6). Impact of miR antagomirs on osteoclasts. Osteoclast cultures were either nontransfected (NT), transfected with miR‐INH 1 nM (miR‐34a‐3p) or 10 nM for all others on day 14 for 48 hours, or transfected with a negative control (Cont). At day 21, the number of cells containing 3 or more nuclei was counted in each condition, and bone resorption was evaluated (ImageJ software). (B) The results are presented as % of resorbed area on each slice, (C) % of multinucleated cells (MNCs) per surface area, (D) resorption per MNC. All results are expressed normalized over nontransfected cultures (NT) (boxplot: median, min–max; n = 6–10). **p < 0.01, *p < 0.05 (versus Cont). (E) Representative images of the effect of miR‐34a‐3p inhibition on resorption and multinucleated cells are presented (scale bar = 10 μm).
