Fig. 6.

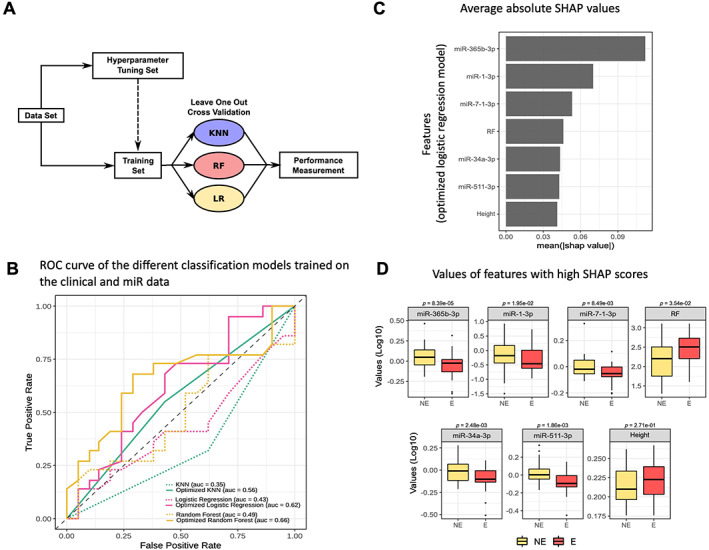
Machine‐learning to model a predictive tool for the development of bone erosions in rheumatoid arthritis (RA). (A) Machine learning: methods. Schematic describing the pipeline to build the classifiers. The model names are KNN for K nearest neighbor; RF for random forest; LR for logistic regression. (B) Receiver operating characteristic (ROC) curves of the different classification models trained on the clinical and microRNA (miR) data. The gray color represents the type of machine‐learning model (KNN, logistic regression, and random forest); the line type indicates whether the model was optimized or not. (C) Average absolute SHAP values related to the variables used to train the optimized logistic regression model. These SHAP values were computed using the SHAP python library. The variables were ordered in descending order of importance based on their SHAP values. (D) Distributions of values of features with high SHAP scores for the optimized logistic regression model (NE = nonerosive RA; E = erosive RA). The results (Log10 values) are presented as boxplots (median, min–max) (replication cohort, n = 86).
