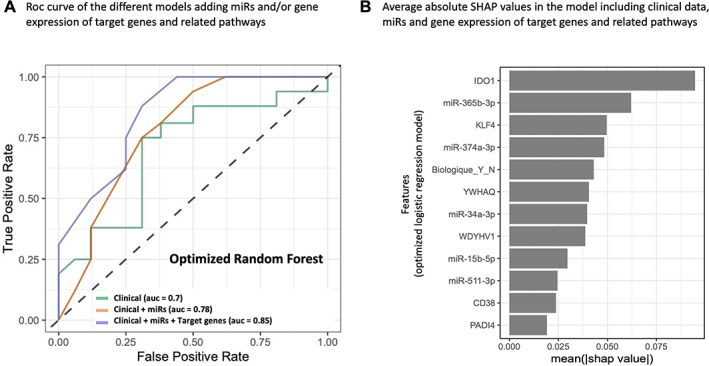
Fig. 7.

Receiver operating characteristic (ROC) curves of the different classification models considering or not gene expression. (A) A comparison of the models trained on the clinical data alone or with microRNA (miR) data, as well as with gene expression data from target genes and related pathways. For this model, the number of available samples was smaller (replication cohort, n = 60 patients for whom clinical data and expression of miRs and related genes were available). (B) Average absolute SHAP values related to the variables used to train the optimized logistic regression model. These SHAP values were computed using the SHAP python library. The variables were ordered in descending order of importance based on their SHAP values.
