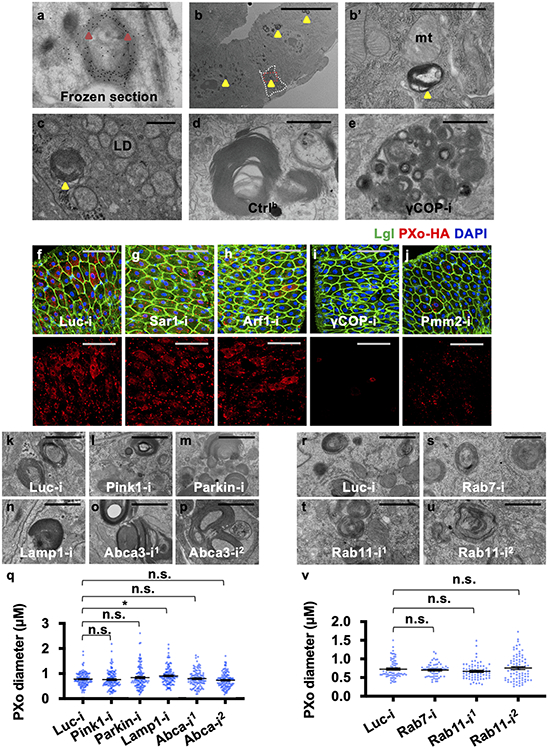
Extended Data Figure 4. Related to Figure 2. Analysis of the dependency of PXo bodies on other canonical organelles.
a, EM of midgut frozen section with immunogold-labeled GFP-PXo (examples highlighted with arrowheads) expressed in progenitors. b, Midgut EM shows unlabeled PXo bodies mainly in ECs (examples highlighted with arrowheads). A progenitor cell, as circled out by dashed line, can be distinguished from ECs, based on its basal localization, high electron density, lack of microvilli, and lack of mitochondria (“mt”) cristae. A magnified view of the squared region, as presented in (b’), shows a PXo body in the progenitor. c, Midgut EM distinguishes the membranous PXo bodies (highlighted with arrowhead) from lipid droplets (“LD”). d, e, EM shows PXo body fragmentation in midguts with ubiquitous γCOP knockdown for 7d. f, g, h, i, j, HA staining of midguts expressing PXo-HA together with Luc RNAi, Sar1 RNAi, Arf1 RNAi, γCOP RNAi, or Pmm2 RNAi in ECs for 7d. Lethal giant larvae (Lgl) marks cell border. k, l, m, n, o, p, EM showing PXo bodies in ECs expressing Luc RNAi, Pink RNAi, Parkin RNAi, Lamp1 RNAi, or Abca RNAi for 7d, with PXo body size quantification in (q). N=110 (Abca-i1) or 120 (other groups). P values from bottom to top: 1.00, 0.747, 0.0162, 1.00, 1.00. r, s, t, u, EM showing PXo bodies in ECs expressing Luc RNAi (N=70), Rab7 RNAi (N=60), or Rab11 RNAi (line #1: N=70; line #2: N=80) for 3d, with quantification in (v). P values from bottom to top: 1.00, 0.490, 1.00. Data are mean ± SEM. P values are calculated from one-way ANOVA with Bonferroni’s multiple comparison test. Scale bars, 1 μm (a, b’, c-e, k-p, r-u), 10 μm (b), 50 μm (f-j).

