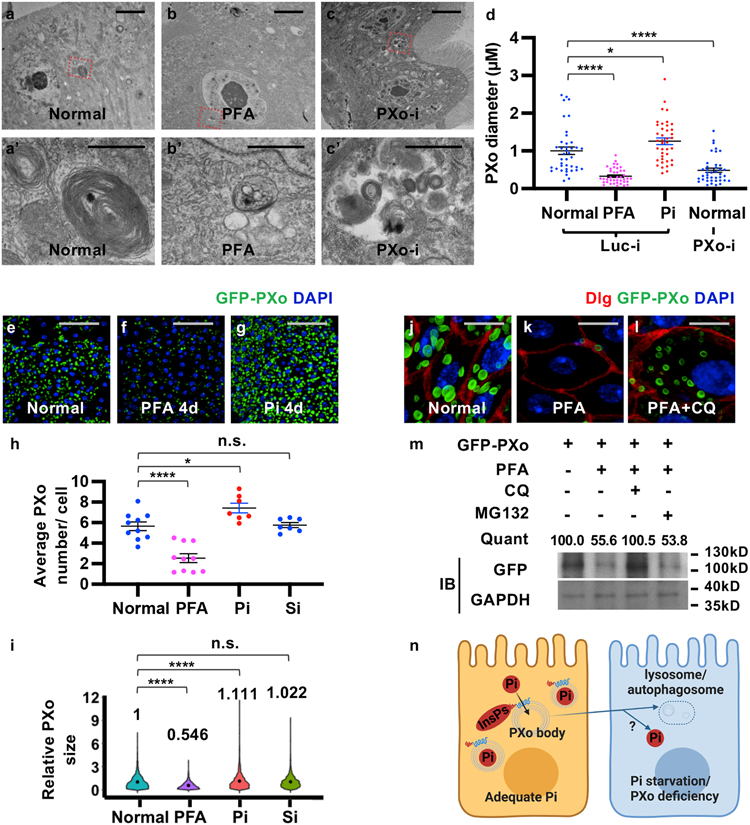
Figure 4. PXo bodies are sensitive to Pi availability.
a, b, c, EM of midguts ubiquitously expressing Luc RNAi or PXo RNAi for 5d, with or without last 4d on PFA. Magnified views show highlighted regions in (a’, b’, c’). d, PXo body diameters in EM of midguts ubiquitously expressing 5d Luc RNAi (with normal food, 4d PFA, or 4d Pi) or PXo RNAi. N=40 per group. P values from bottom to top: 3.00E-9, 0.0465, 4.34E-6. e, f, g, Midguts with 7d ubiquitously GFP-PXo expression, on normal food, 4d PFA, or 4d Pi. Average PXo body number per cell is quantified in (h). Relative PXo size is presented as violin plots with mean values (i). Sodium sulfate (Si) group was added to control for Pi food anion concentrations. N=10 (Normal), 10 (PFA), 7 (Pi), 7 (Si) midguts were analyzed. P values from bottom to top (h): 9.88E-6, 0.0183, 1.00. N=2289 (Normal), 1113 (PFA), 2082 (Pi), 1975 (Si) PXo bodies were analyzed. P values from bottom to top (i): <1E-14, 3.88E-5, 1.00. j, k, l, Midguts expressing GFP-PXo ubiquitously were fed normal food, 2d PFA, or 2d PFA+CQ. m, Immunoblot (IB) of lysates from midguts expressing GFP-PXo and fed normal food, 2d PFA, 2d PFA+CQ, or 2d PFA+MG132. GAPDH was the loading control. Relative normalized anti-GFP IB intensity is quantified. Gel source data are in Supplementary Fig. 1a. n, How PXo bodies transport Pi and respond to Pi starvation or PXo knockdown. The diagram was created using BioRender. Quantitative data (except violin plots and western blots) are mean ± SEM. P values are from one-way ANOVA with Bonferroni’s multiple comparison test (d, h, i). Scale bars, 4 μm (a, b, c), 1 μm (a’, b’, c’), 50 μm (e, f, g), 10 μm (j, k, l).

