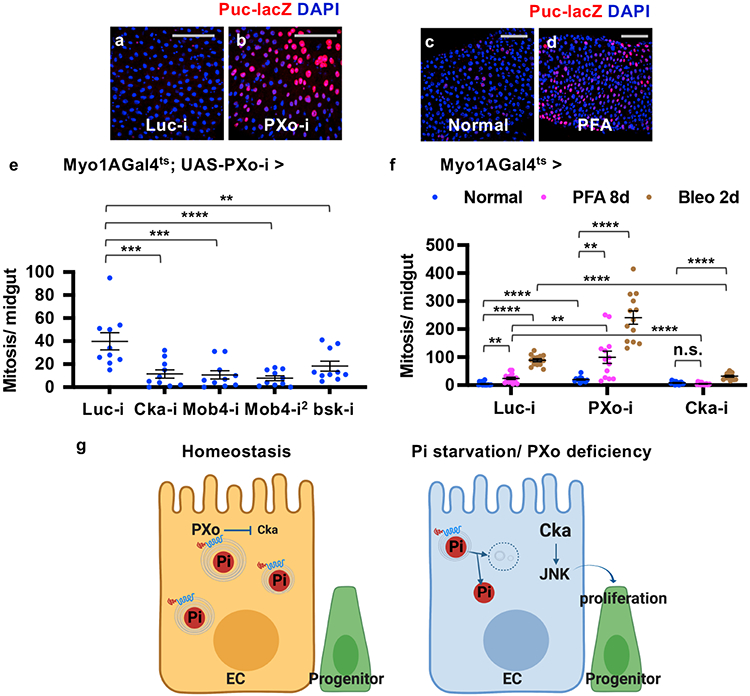
Figure 7. STRIPAK/Cka-JNK signaling mediates the hyperproliferation induced by Pi starvation or PXo knockdown.
a, b, Puc-lacZ staining of midguts expressing Luc RNAi or PXo RNAi in ECs for 7d. ECs have large nuclei identified by DAPI staining. c, d, Puc-lacZ staining of midguts from flies fed normal or PFA food for 7d. e, Mitosis quantification of midguts expressing PXo RNAi together with Luc RNAi, Cka RNAi, Mob4 RNAi (2 different lines), or bsk RNAi in ECs for 8d. N=10 midguts per group. P values from bottom to top: 3.12E-4, 2.10E-4, 4.87E-5, 7.53E-3. f, Mitosis quantification of midguts expressing Luc RNAi, PXo RNAi, or Cka RNAi in ECs for 8d and fed with normal food (N=14, 13, 13), PFA (N=15, 13, 14) or the last 2d Bleo (N=13, 13, 13). P values from bottom to top: 0.101, 1.70E-3, 3.83E-5, 2.10E-3, <1E-14, 1.70E-5, 1.92E-7, 2.87E-8, 9.83E-3, 1.18E-9. g, A schematic summary of the connections between Pi storage, PXo, and Pi signaling. PXo transports Pi into PXo bodies and antagonizes Cka/JNK. The coupling of both roles in PXo, whose conformation and activity are sensitive to cytosolic Pi levels, activates mitogenic JNK signaling under pathological conditions of Pi starvation or PXo deficiency. The diagram was created using BioRender. Data are mean ± SEM. P values are from one-way ANOVA with Bonferroni’s multiple comparison test in (e) and within the same genotype in (f), or two-tailed Mann-Whitney u test between different genotypes in (f). Scale bars, 50 μm (a, b, c, d).

