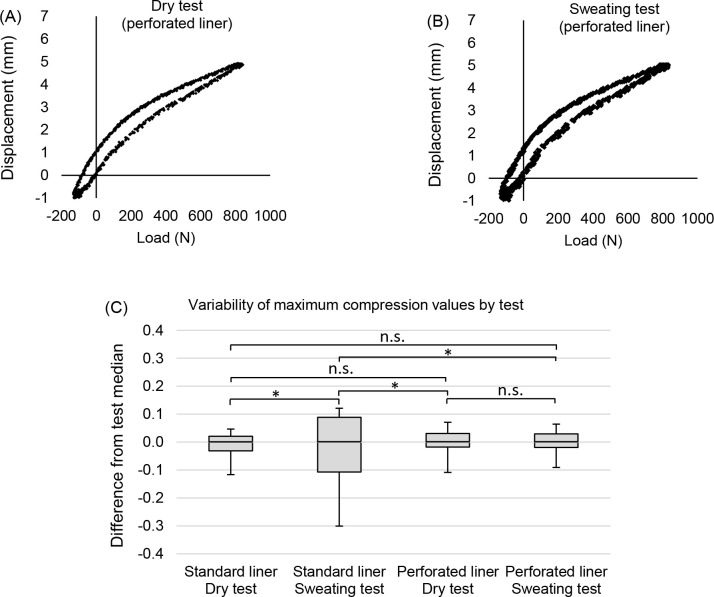
Figure 4:
(A) The hysteresis curve of a dry test with the perforated liner (B) the hysteresis curve of a sweating test with the perforated liner (C) A box-and-whisker plot of the maximum displacement values from the dry and sweating tests with the standard and perforated liners (normalised by median). The box indicates the interquartile range and the whiskers indicate the maximum and minimum values. The lines at the top of the plot show where comparisons of variability were made. Asterisks (*) indicate a significant difference (p<0.05) in variance between tests.

