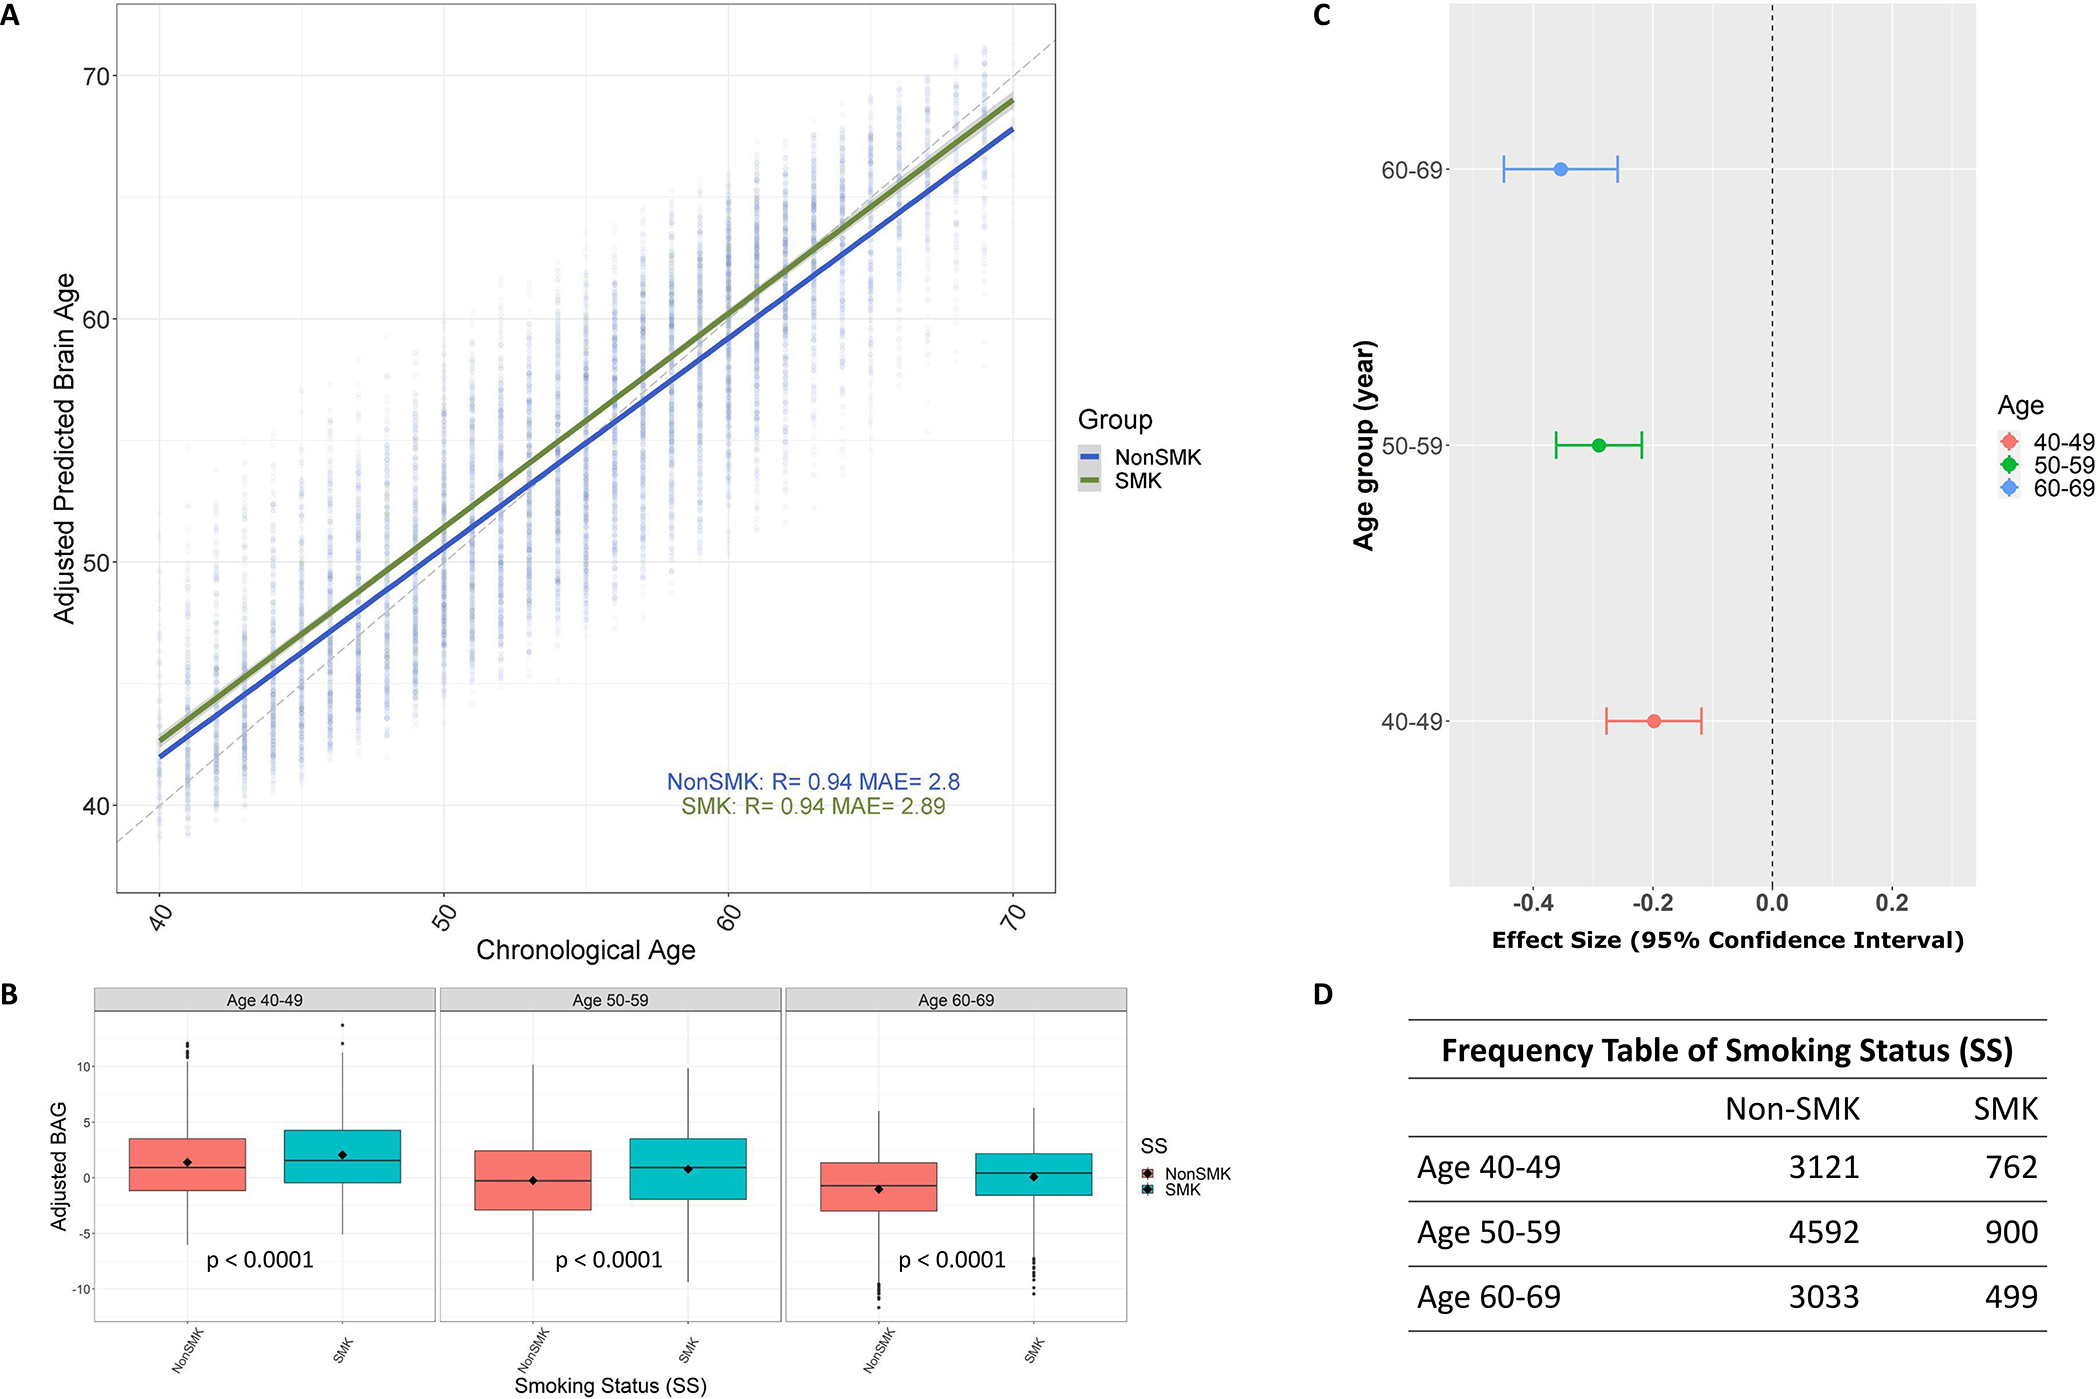
FIGURE 2.

Adjusted brain age gap (BAG) and its relationships with smoking status in the testing set. (a) The relationship between the adjusted predicted brain age and chronological age in different smoking statuses (SS) (R = coefficients of correlation; MAE = mean absolute error). (b) The distribution of adjusted BAG between different SS groups in separate chronological age categories, where P indicates the P-value corresponding to the comparison between nonsmokers (non-SMK) and smokers (SMK) in each category. (c) The effect size with the 95% confidence interval for testing the difference between non-SMK and SMK within each age category based on (b). (d) The number of participants in each age group corresponding to comparisons between non-SMK and SMK in (b)
