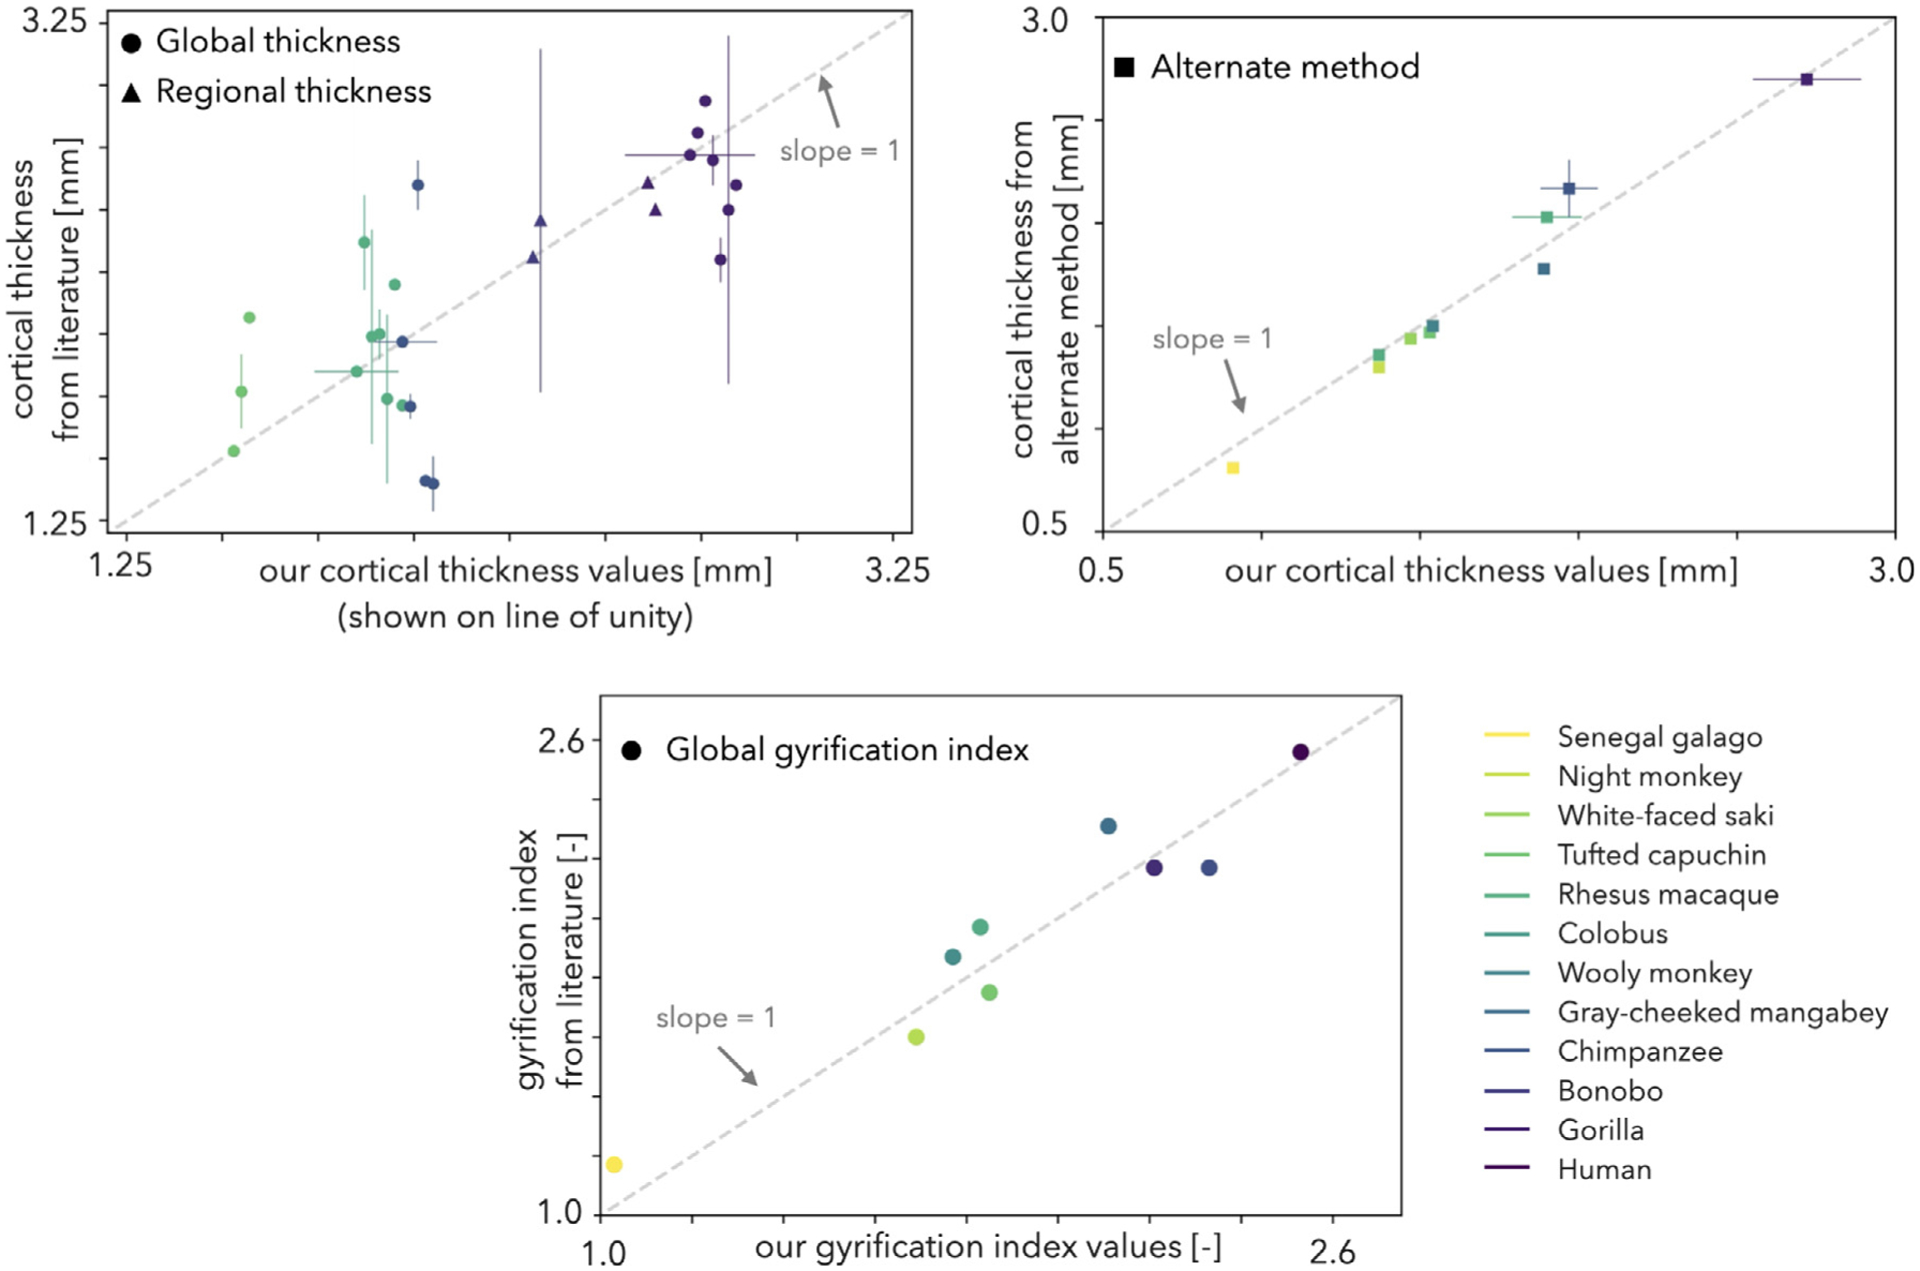
Fig. 4.

Comparison of our global cortical thickness (top) and gyrification index (GI, bottom) values with data collected from literature for the 12 species investigated. The dashed lines represent unity. Global data (●) were collected when available; if not, regional data (▲) were averaged to get a global estimate. Error bars represent the cumulative standard deviation of all standard deviations collected from each publication. A methodological comparison was also conducted comparing results for the same specimen from our computational pipeline to Freesurfer’s and CAT12’s surface-based morphometry approach (humans and chimpanzees respectively) and ANT’s volumetric cortical thickness algorithm (rhesus macaques) (■). Sources for cortical thickness data are listed in Table 3; all GI values were found in Zilles et al. (2013). The full cortical thickness data represented in this figure is available on Github (https://github.com/mholla/NIMG23).
