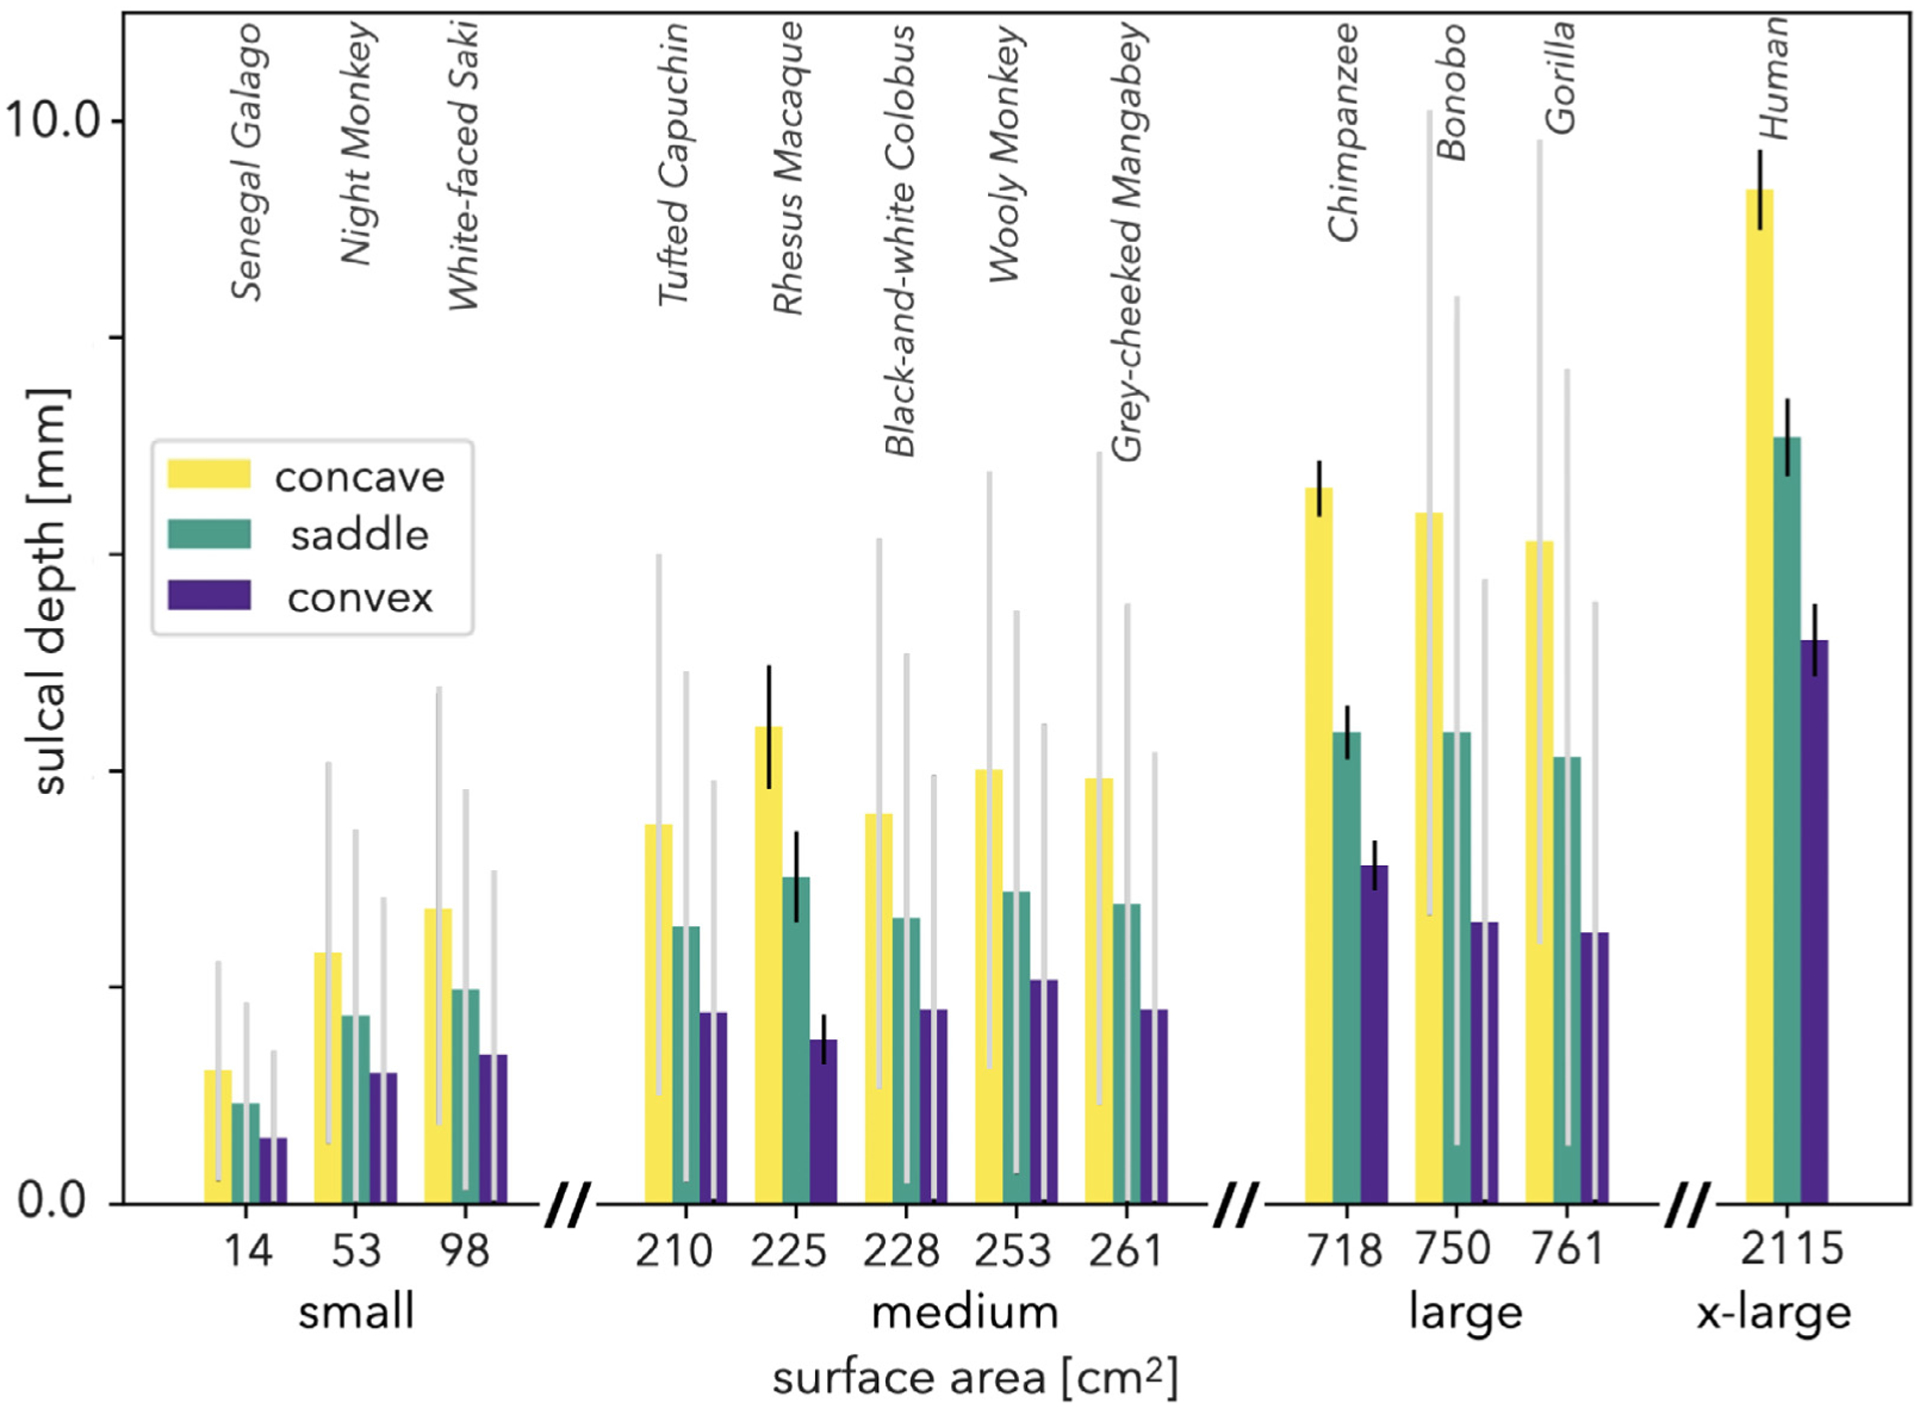
Fig. 7.

Average sulcal depth of all concave, saddle, and convex shaped points of the cortex with respect to total cortical surface area of each species. Convex points are clustered on gyral ridges, concave points on sulcal valleys, and saddle points in the middle. N = 31, N = 54, and N = 501 for rhesus macaques, chimpanzees, and humans respectively. Error bars represent one standard deviation. For species with single subjects, gray error bars represent variation within subjects. For species with multiple subjects, black error bars represent variation across subjects.
