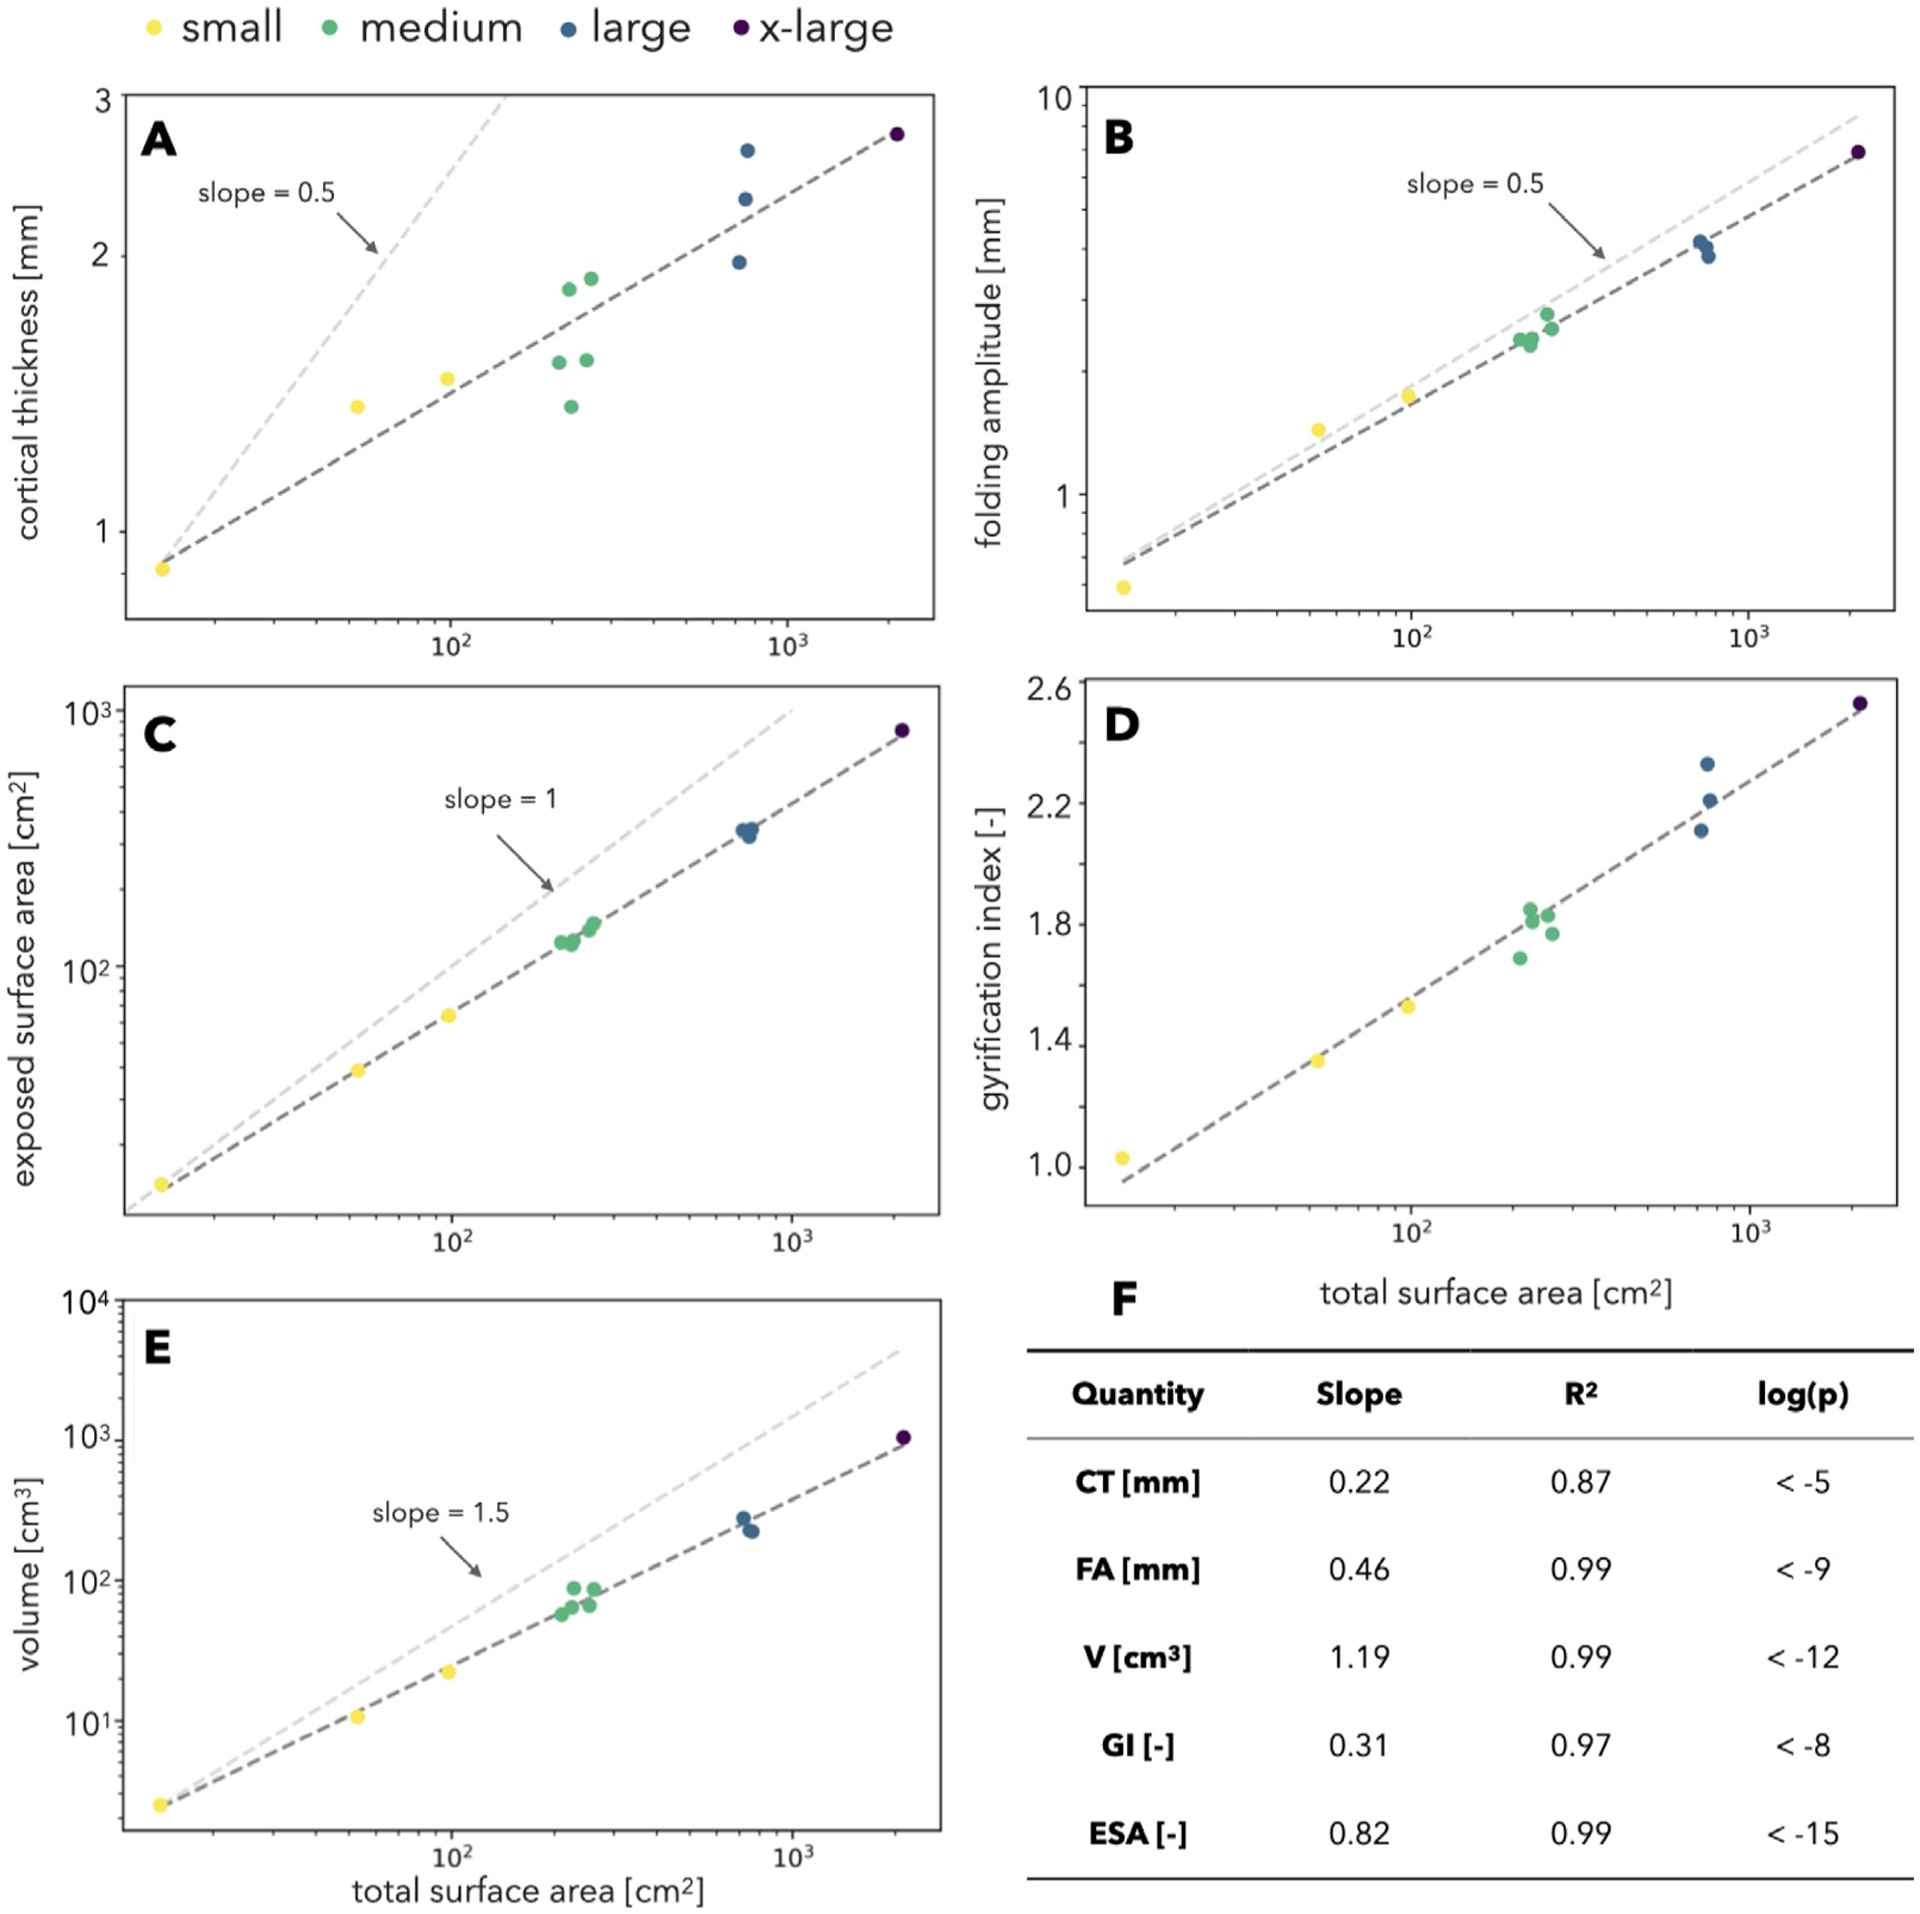
Fig. 9.

Allometric scaling relationships of measures of brain morphology with surface area. Data from 12 primate species are shown for cortical thickness (A), folding amplitude (B), exposed surface area (C), gyrification index (D), and volume (E). A power regression was performed, and the line of best fit is shown, with the slope and correlation values listed (F). Additionally, for dimensioned quantities, the predicted relationship in the case of isometric scaling is indicated with gray dotted lines for comparison.
