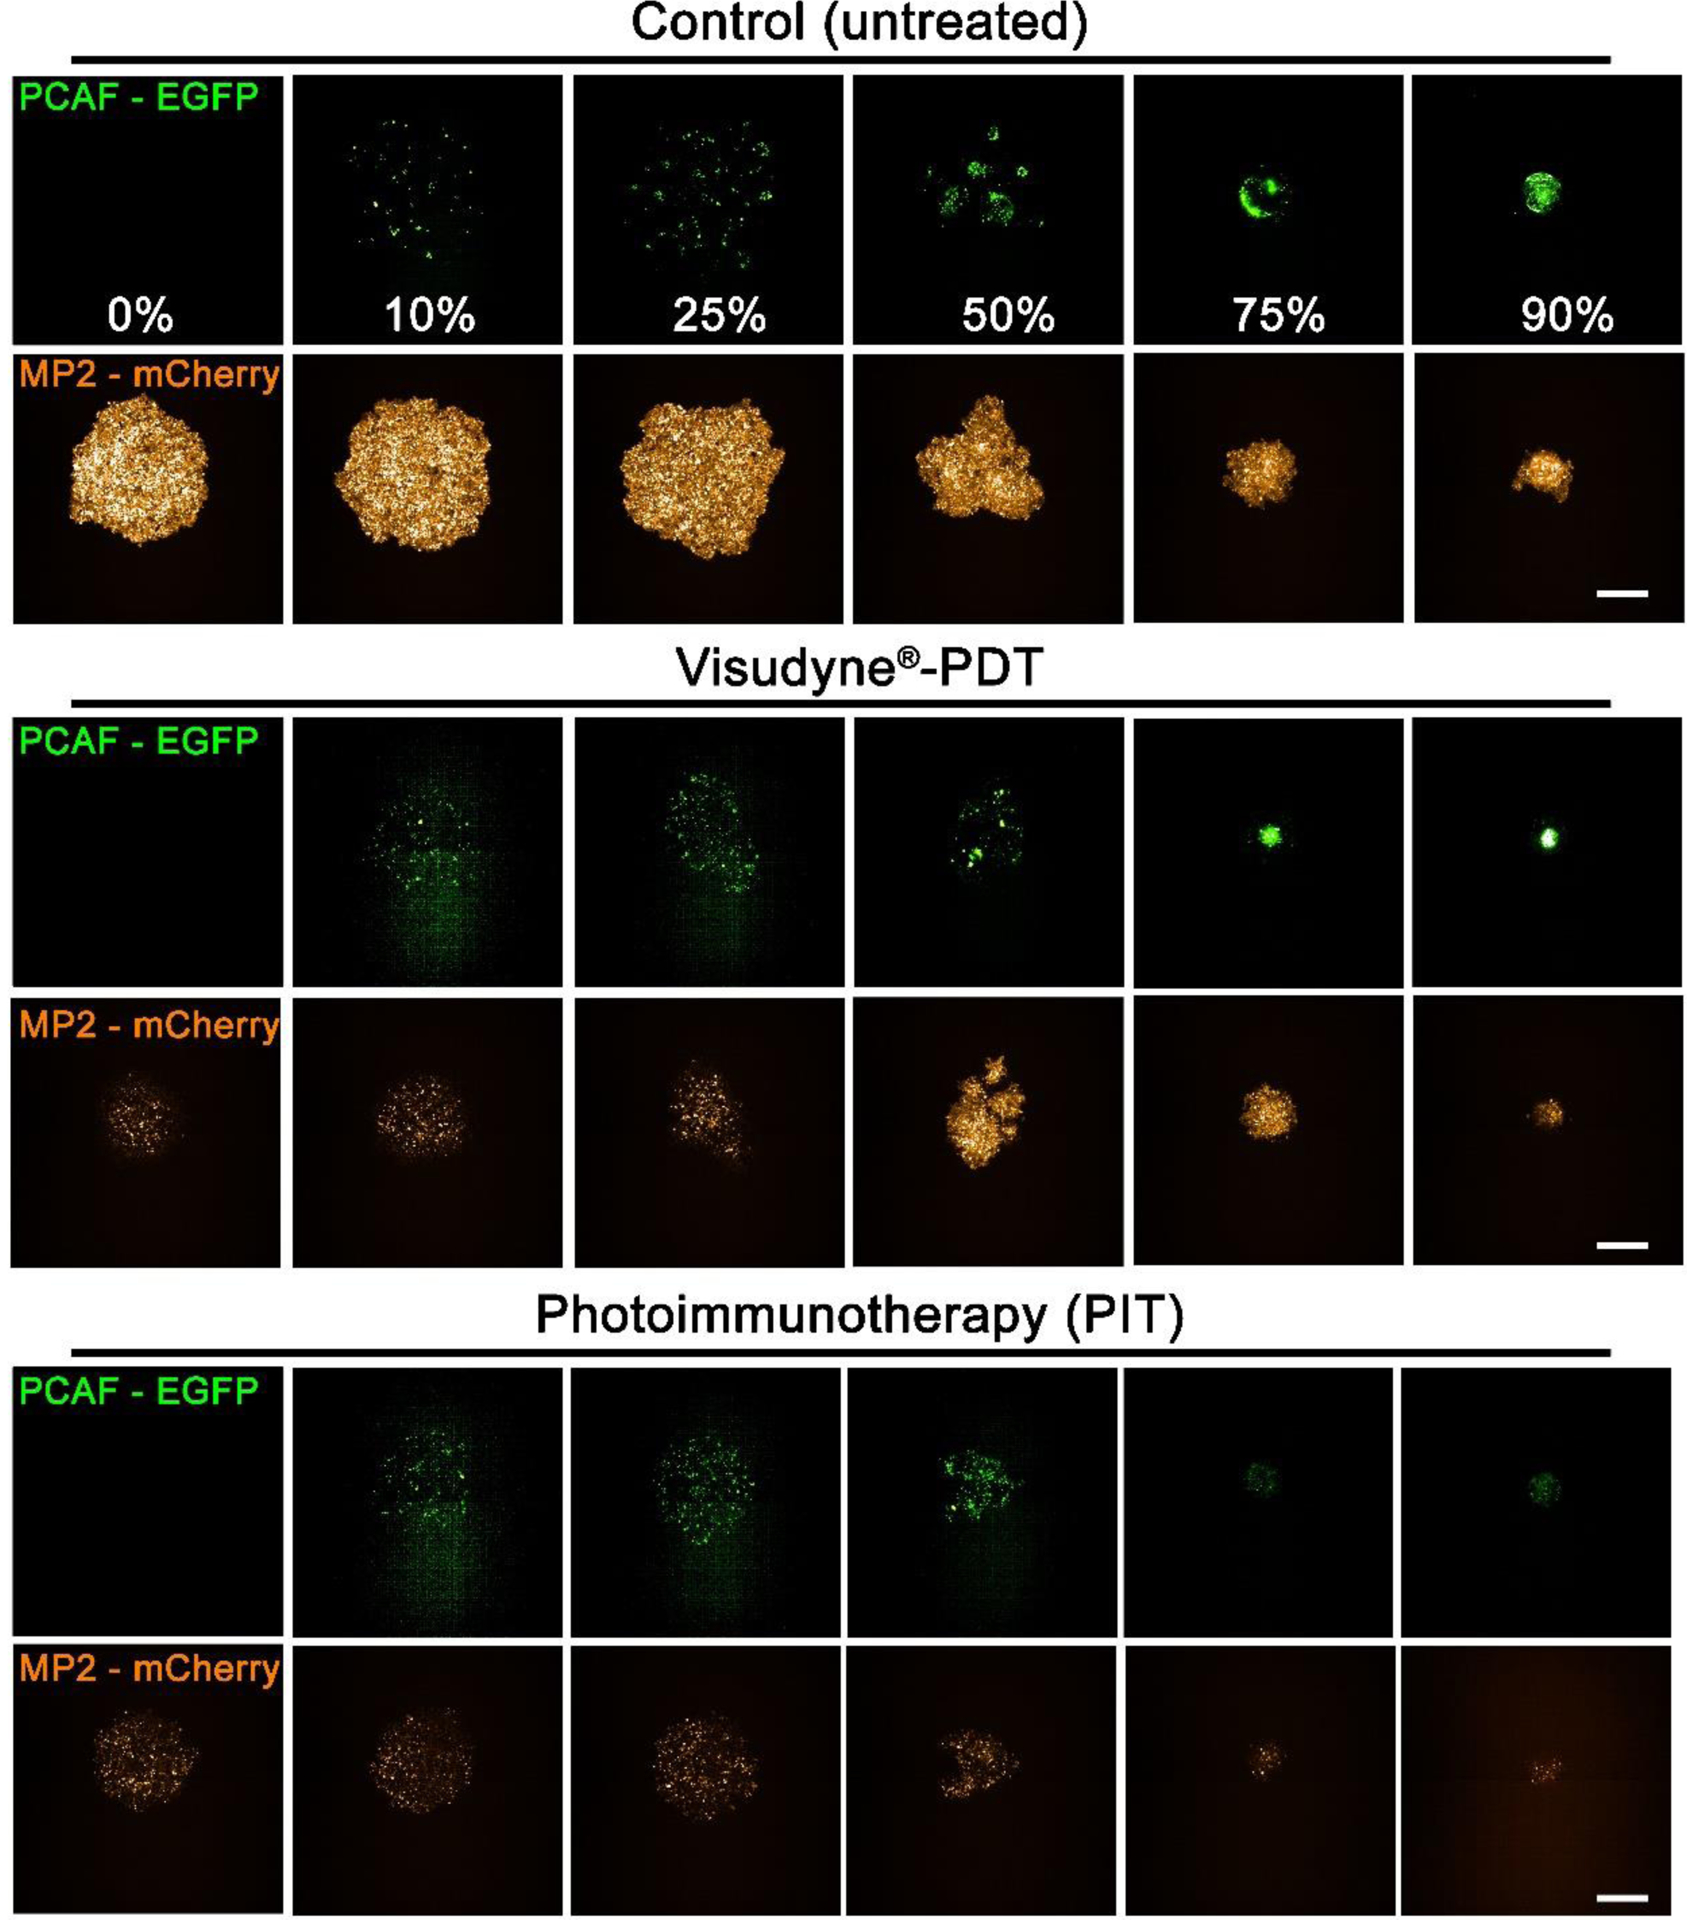
Figure 4: Response of heterotypic Mia PaCa-2-PCAF 3D cultures to Visudyne®-PDT and PIT.

Maximum intensity projection (MIP) of fluorescence signals from Mia PaCa-2-PCAF spheroids with different PCAF percentage on day 3 post-PDT. PCAF percentage is mentioned in the top panel (control spheroids PCAF-EGFP panel). Scale bar corresponds to 500 μm.
