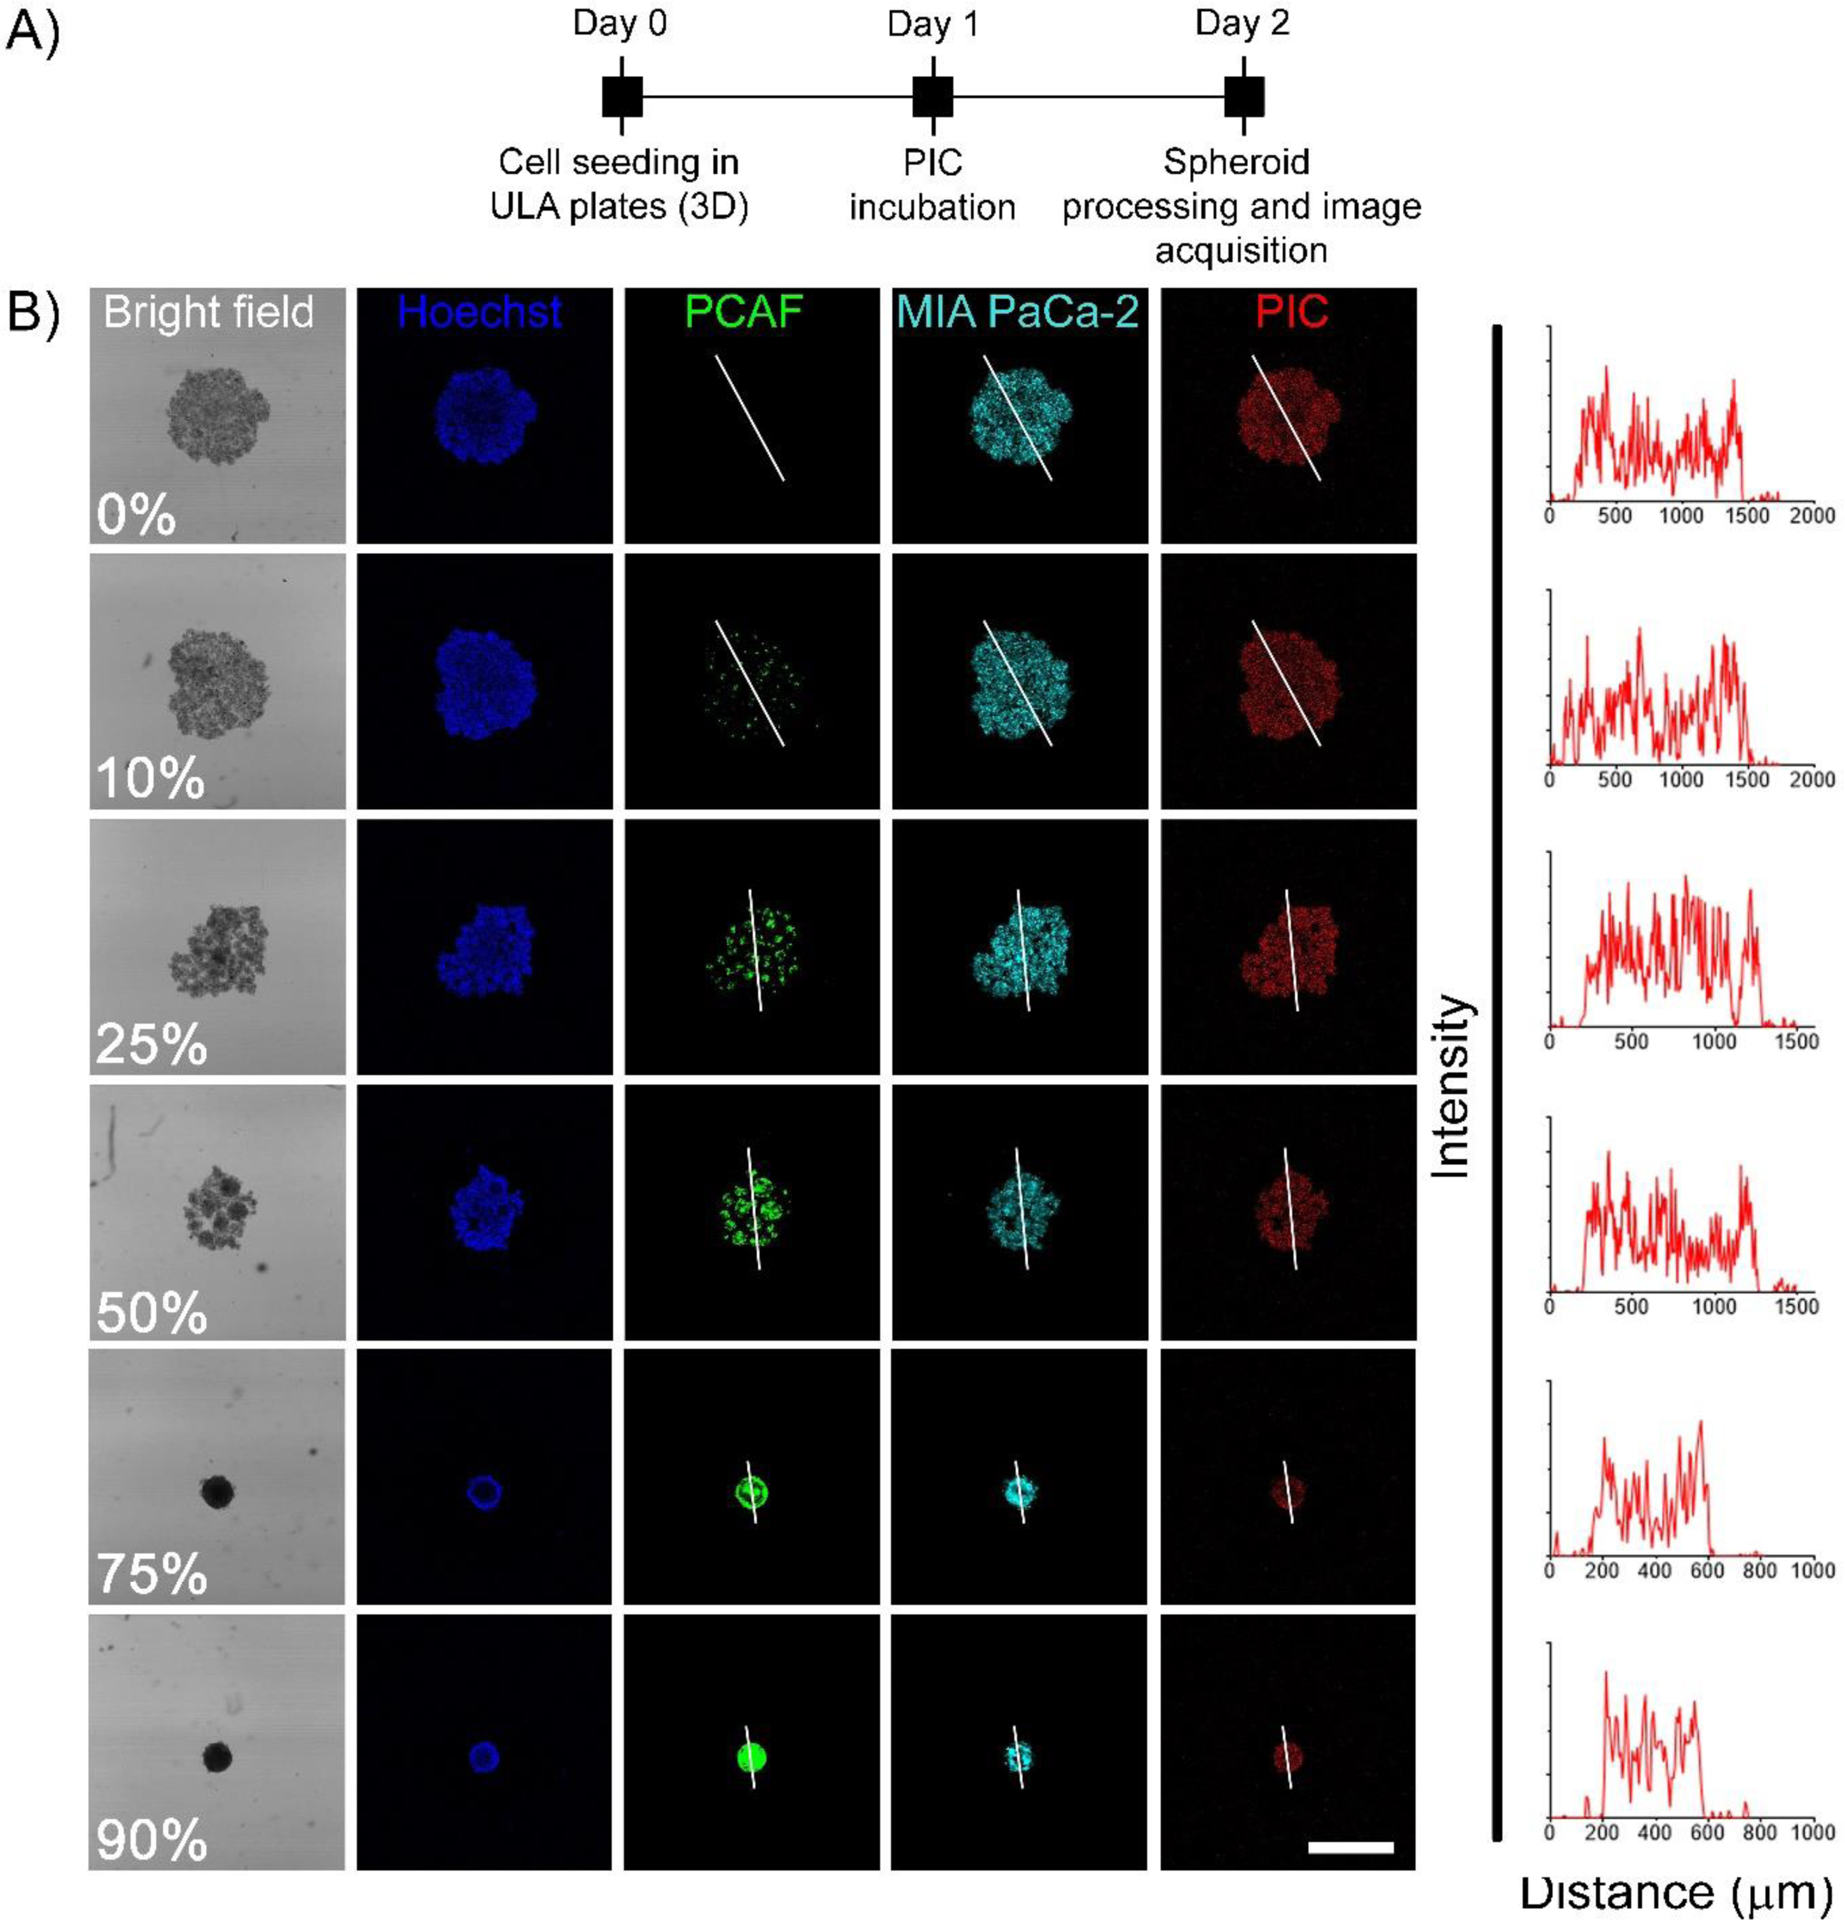
Figure 7: PIC administered photosensitizer distribution in heterotypic 3D spheroids.

(A) Experimental timeline for studying BPD uptake and distribution in homotypic and heterotypic spheroids using PICs. Cells were seeded in CellCarrier Spheroid ULA 96-well Microplates followed by incubation with PICs for 24 h. The spheroids were then washed, fixed in PFA, counter-stained with Hoechst and visualized under a confocal fluorescence microscope. (B) Representative confocal images of the central optical section of the 3D spheroids. Mia PaCa-2 cells and PCAFs are pseudo-colored as cyan and green. Nuclei are stained with Hoechst (pseudocolored as blue) and BPD is shown in red. Profile plots were generated using image J to monitor BPD distribution across the central plane. As suggested by the profile-plots, the distribution of BPD was homogeneous across the central section irrespective of the spheroid composition (scale bar = 500 μm).
