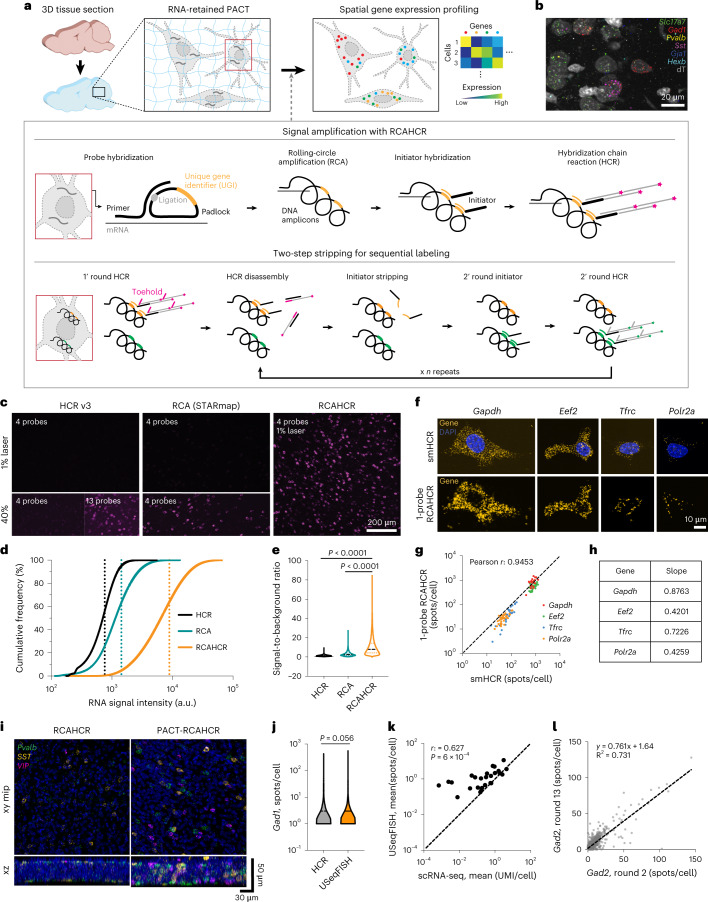
Fig. 1. USeqFISH for highly sensitive, spatial gene expression profiling in 3D, intact tissue.
a, Schematic procedure of USeqFISH. b, Representative maximum intensity projection image of USeqFISH with six selected genes and a cytosolic marker (dT) in mouse cortex. c, In situ detection of Gad1 with four probes using HCR version 3, RCA (STARmap) and RCAHCR amplification. The same region was imaged twice with 1% and 40% laser power. For HCR, we confirmed its ability to detect RNA by adding more probes (13 probes total). d, Cumulative distribution of RNA signal intensity of HCR-only, RCA-only and RCAHCR amplification. Dashed lines indicate the mean of each distribution (a.u., arbitrary units). e, SBR of HCR-only, RCA-only and RCAHCR amplification (two-sided unpaired t-test with Welch’s correction). f, Comparison of smHCR and subsequent 1-probe RCAHCR with four housekeeping genes (Gapdh, Eef2, Tfrc and Polr2a) in the same NIH3T3 cells. g, The quantification of spots per cell detected by smHCR and subsequent 1-probe RCAHCR. The Pearson correlation coefficient (r) of four genes was 0.9453. h, The slope of each gene in g. i, Comparison of RCAHCR penetration without (‘RCAHCR’) and with RNA-retained PACT clearing (‘PACT-RCAHCR’) in 50-µm-thick brain tissue. We labeled three genes (Pvalb: green, Sst: yellow and Vip: magenta) with three orthogonal hairpin pairs in the same tissue. j, Comparison of Gad1 spot numbers per cell detected with HCR (gray; n = 2,322 cells) and with USeqFISH (orange; n = 3,403 cells; two-sided unpaired t-test with Welch’s correction). k, Comparison of the expression level of 26 endogenous genes (Supplementary Table 1) measured as mean spot numbers per cell with USeqFISH and mean UMI counts per cell with scRNA-seq (r: Pearson correlation coefficient; P: P value). The dashed line indicates x = y. l, Comparison of Gad2 spot numbers per cell detected with USeqFISH at round 2 and round 13 in the same tissue. Each spot indicates the same cell. The dashed line indicates linear regression.

