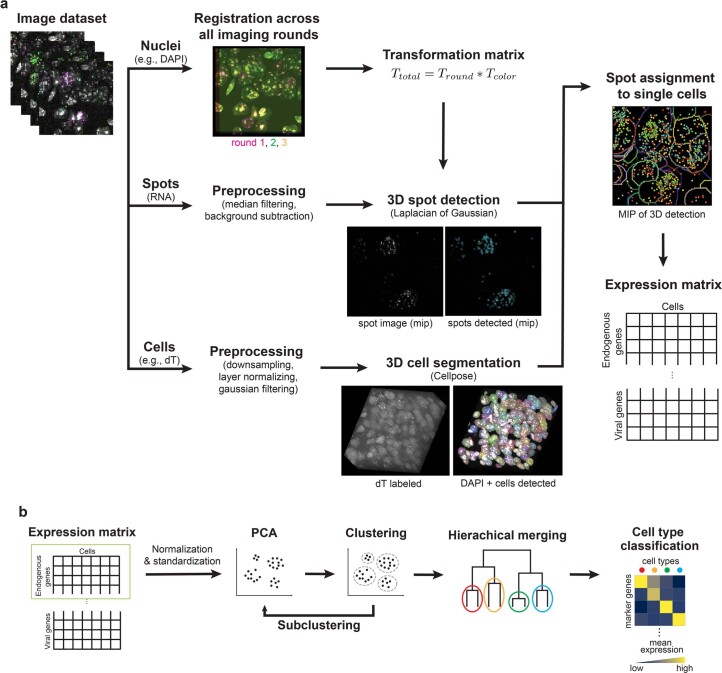
Extended Data Fig. 6. Automated 3D image processing and quantitative data analysis pipeline for USeqFISH.
a, A collection of volume imaging data for each USeqFISH experiment consists of nuclei labeling and RNA spots for each round and cytosolic labeling for the last round. Using the nuclei labeling for each round, we calculated the rigid transformation matrix to the last image for registration across imaging rounds. We combined this transformation matrix with one for correcting optical aberration obtained with fluorescent microbeads prior to the experiment. For RNA spot detection, we proceeded with smoothing by 3-pixel median filtering and background subtraction for each volume and applied a Laplacian of Gaussian filter to obtain the location of each spot. For cell body segmentation, we pre-processed the dT labeled image and used it to identify single cells by applying Cellpose. These three calculations were then combined to register all volumes into the same coordinates, to assign each spot to each cell, and finally to obtain the cells-by-genes expression matrix. b, The expression matrix of endogenous genes was then normalized and z-standardized and used to cluster cell types with endogenous genes by applying principal component analysis (PCA), followed by Leiden clustering. The viral gene expression profiles were analyzed along the clusters identified (details in Methods and Fig. 3a).

