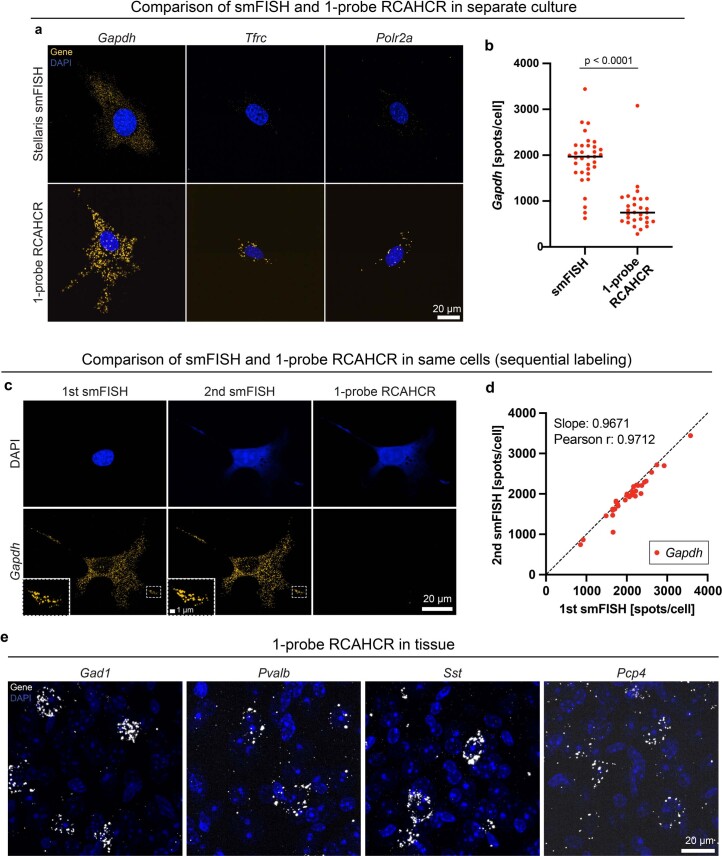
Extended Data Fig. 2. Further characterization of 1-probe RCAHCR.
a, Representative images of three house keeping genes (Gapdh, Tfrc, and Polr2a) detected by smFISH and 1-probe RCAHCR in different NIH3T3 cells. b, Quantification of Gapdh spots/cells detected by smFISH and 1-probe RCAHCR (two-sided unpaired t-test). c, Representative images of Gapdh spots sequentially detected by 1st smFISH, 2nd smFISH, and 1-probe RCAHCR in the same NIH3T3 cells. The probe stripping was performed by DNase I treatment (0.5 U/µl). Note that the probe used for 1-probe RCAHCR is the same as in a. d, Quantification of 1st and 2nd smFISH spots in the same cells. The slope estimated from linear regression was 0.9671, and the Pearson correlation coefficient (r) was 0.9712. e, Representative images of Gad1, Pvalb, Sst, and Pcp4 genes detected by 1-probe RCAHCR in mouse brain tissue.

