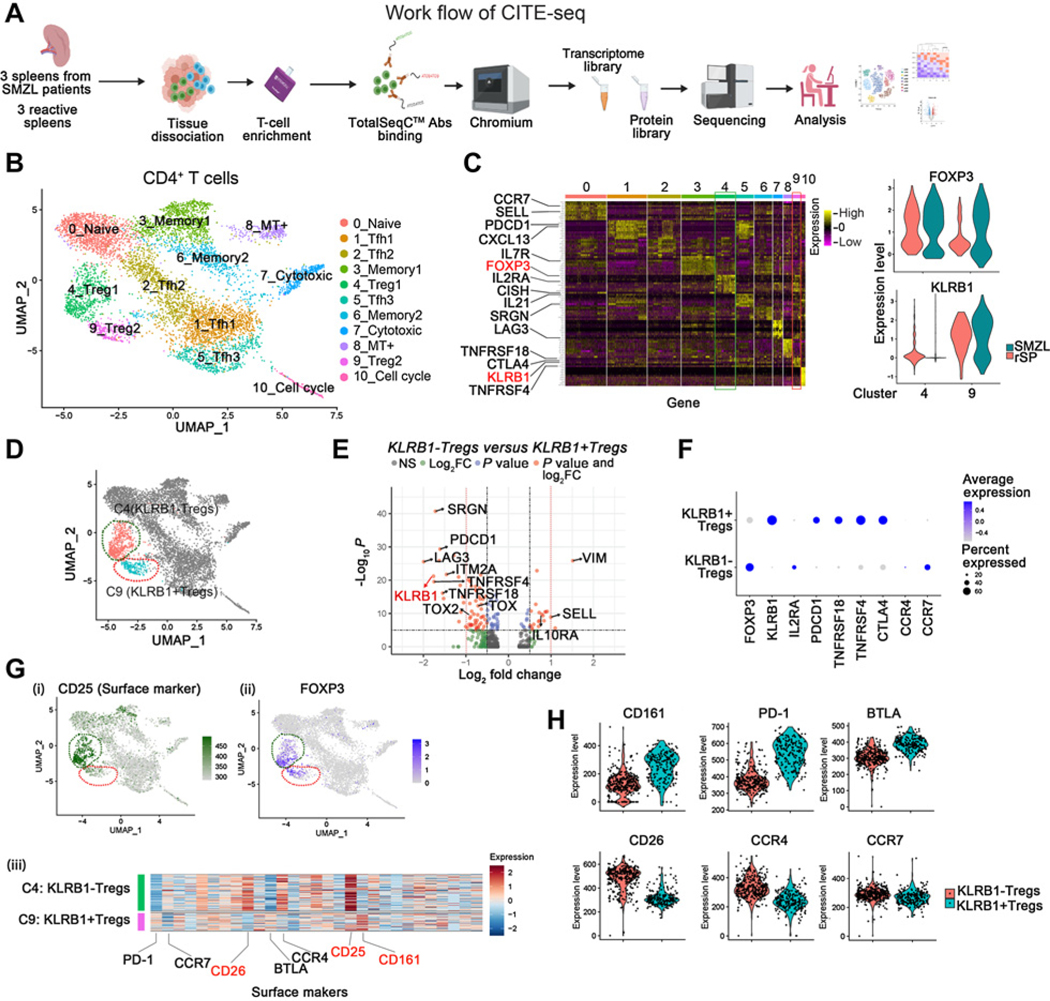
Figure 2.
Multi-omics analysis of CD4+T cells identifies Treg subsets in SMZL. A, Schematic representation of T cell enrichment strategy and CITE-seq experimental design. B, UMAP plot visualization of intratumoral CD4+T cell clusters detected in rSP (n = 3) and SMZL (n = 3), and clusters are colored and distinctively labeled. C, Heatmap showing relative expression of marker genes of each cluster (left). Violin plots showing the FOXP3 and KLRB1 expression levels in cluster4 and cluster9 (right). D, Diffusion map of FOXP3+Treg subsets (Cluster4: KLRB1-Tregs, Cluster9: KLRB1+Tregs) in CD4+T cells in patients with SMZL and rSP individuals. E, Volcano plot of CITE-seq transcriptome data displaying the pattern of gene expression values for Cluster4 (KLRB1-Tregs) versus Cluster9 (KLRB1+Tregs) in SMZL samples (n = 3). Significantly differentially expressed genes (|log2FC| ≥ 0.5, adjusted P value ≤ 10–6) are shown in red, with the red dotted lines representing the boundary for identifying very significantly up- or downregulated genes (|log2FC| ≥ 1.0). F, Dot plot showing diverse gene expression in KLRB1+Tregs and KLRB1-Tregs in three SMZL samples. G, (i) Expression of CD25 (surface marker) was shown by using UMAP plot. (ii) Expression of FOXP3 was shown by using UMAP plot. (iii) Heatmap showing relative expression of surface markers of Cluster4 (KLRB1-Tregs) and Cluster9 (KLRB1+Tregs). These three figures show data from rSP (n = 3) and SMZL (n = 3). H, Violin plots showing the CD161 (encoded by KLRB1 gene), CD26, PD-1, CCR4, BTLA, and CCR7 expression levels in KLRB1+Tregs and KLRB1-Tregs from rSP (n = 3) and SMZL (n = 3).

