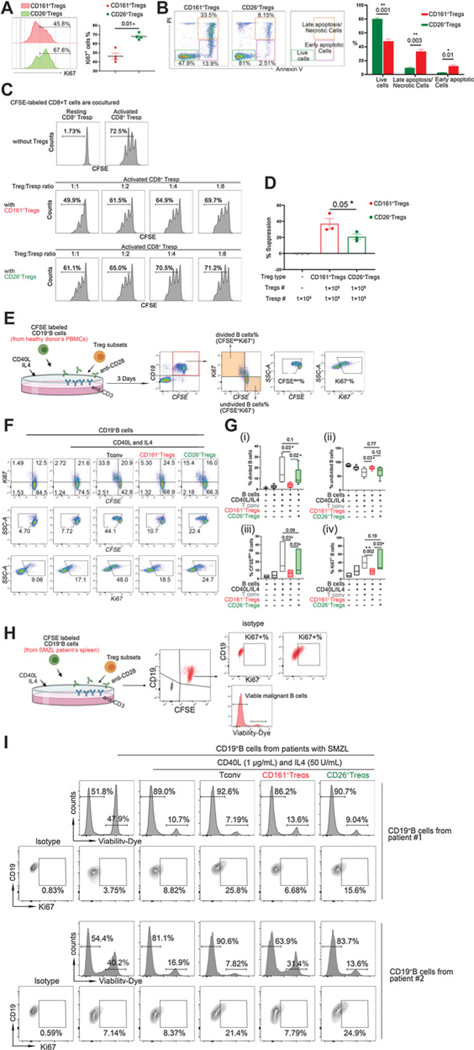
Figure 4.
CD161+ and CD26+Tregs exhibit differing capacities for cell proliferation, survival, and immune suppression. A, Proliferation of Treg subsets, isolated from PBMCs of healthy donors, was evaluated by detecting the percentage of Ki67+ cells and is shown in representative histograms (left). The Ki67+ population in CD26+Tregs increased significantly compared with CD161+ Tregs (right); paired t test was used here (n = 4 individual healthy donors). B, Treg subsets, isolated from PBMCs of healthy donors, were labeled with Annexin V (AnV) and propidium iodide (PI) after 72 hours of incubation; the percentages of necrotic cells (AnV+PI+), early apoptotic cells (AnV+PI−), and live cells (AnV−PI−) are shown in the representative plots (left and central panel). The percentage of live cells (AnV−PI−) was significantly lower in CD161+Tregs than that of CD26+Tregs. In contrast, the percentage of early apoptotic (AnV+PI−) and late apoptotic/necrotic (AnV+PI+) cells was significantly higher in CD161+Tregs than CD26+Tregs (right); paired t test was used here (n = 3 individual healthy donors). C, Representative plots showing the percentage of divided CD8+T (T response cells, Tresp) cells when cocultured with Treg subsets at different ratios (Treg subsets:Tresp = 1:1–8); cells were isolated from PBMCs of a healthy donor. D, Suppressive function was calculated [%Suppressive = 1 – (%proliferating cells with Treg present/%proliferating cells without Treg present)], and the suppressive function of CD161+Tregs on CD8+T cells is significantly stronger; paired t test was used here (n = 3 individual healthy donors). E, Schematic representation of Treg subsets co-cultured with B cells experimental design. F, Representative plots of CFSE-labeled B cells co-cultured with different T-cell subsets in the presence of CD40L, IL4, functional anti-CD3, and anti-CD28 antibodies (CD40 L and IL4 are for B-cell activation, functional anti-CD3 and anti-CD28 antibodies are for T-cell activation); cells were isolated from PBMCs of healthy donors. G, Proliferation ability of B cells was detected. (i) Graph shows percentage of divided B cells when cocultured with Tconv and Treg subsets. (ii) Graph shows percentage of undivided B cells when cocultured with Tconv and Treg subsets. (iii) Graph shows percentage of CFSEdim B cells when cocultured with Tconv and Treg subsets. (iv) Graph shows percentage of Ki67+ B cells when cocultured with Tconv and Treg subsets. Compared with CD26+Tregs and conventional T cells, CD161+Tregs show significant suppression on the percentage of divided cells and CFSEdim cells and Ki67 expression of Bcells;paired t test was used here (n = 6, the experiments were conducted on the cells that were isolated from 6 individual healthy donors). H, Schematic representation of Treg subsets co-cultured with malignant B cells experimental design. I, CD19+B cells from spleen of 2 patients with SMZL cocultured with Treg subsets (from healthy donor PBMCs) at 1:1 ratio. Viability (%viability-dye negative cells) and proliferation ability (%Ki67+ cells) of malignant B cells was detected by FCM.

