Figure 5.
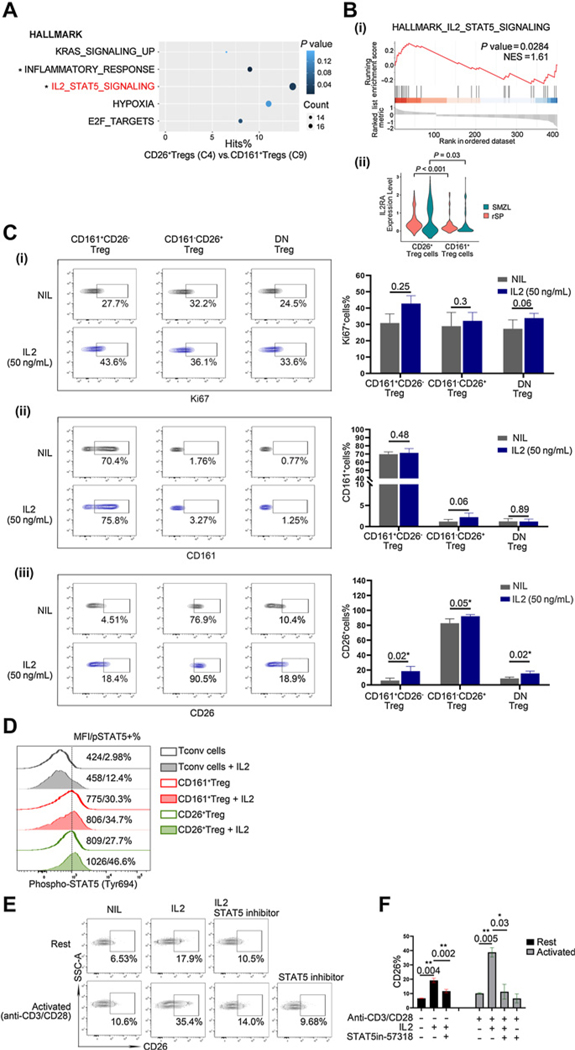
IL2 promotes the development of CD26+Tregs with the involvement of STAT5. A, Scatterplot of enriched GSEA pathways. Y-axis represents pathway name, and X-axis represents the percentage of gene hits. Size and color of each bubble represent the number of differentially expressed genes enriched in the pathway and P value, respectively. B, (i) The enrichment score curve showing alteration of signaling pathways involving IL2/STAT5 pathway in Treg subsets from patients with SMZL, n = 3. The enrichment score normalized (NES) greater or less than zero indicates an upregulation or downregulation, respectively. These data were generated using GSEA. (ii) Violin plot showing the IL2RA gene expression levels in CD26+Tregs and CD161+Tregs (SMZL: P = 0.03; rSP: P < 0.001). C, (i) Contour plots showing expression of Ki67 in each Treg subset in the presence of IL2. The percentages of Ki67+ cells induced by IL2 were summarized in the graph; Wilcoxon matched-pairs signed rank test and paired t test were used here (n = 3). (ii) Contour plots showing expression of CD161 on each Treg subset in the presence of IL2. The percentages of CD161+ cells induced by IL2 are summarized in the graph; paired t test was used here (n = 3). (iii) Contour plots showing expression of CD26 on each Treg subset in the presence of IL2. The percentages of CD26+ cells induced by IL2 are summarized in the graph; paired t test was used here (n = 3). The experiments were conducted on the cells that were isolated from three individual healthy donors. D, Histogram plots show the STAT5-Tyr694 phosphorylation in CD161+Tregs, CD26+Tregs with or without IL2 treatment (50 ng/mL for 20 minutes); Treg subsets were isolated from PBMCs of healthy donors. E, Contour plots showing expression of CD26 on DN Tregs (CD161−CD26−) in the presence of IL2 (50 ng/mL) and with or without STAT5 inhibitor (57318; 50ng/mL), Treg subsets were isolated from PBMCs of healthy donors. F, The percentages of CD26+Tregs induced by IL2 plus STAT5 inhibitor (57318) are summarized in the graphs (n = 3 individual healthy donors).

