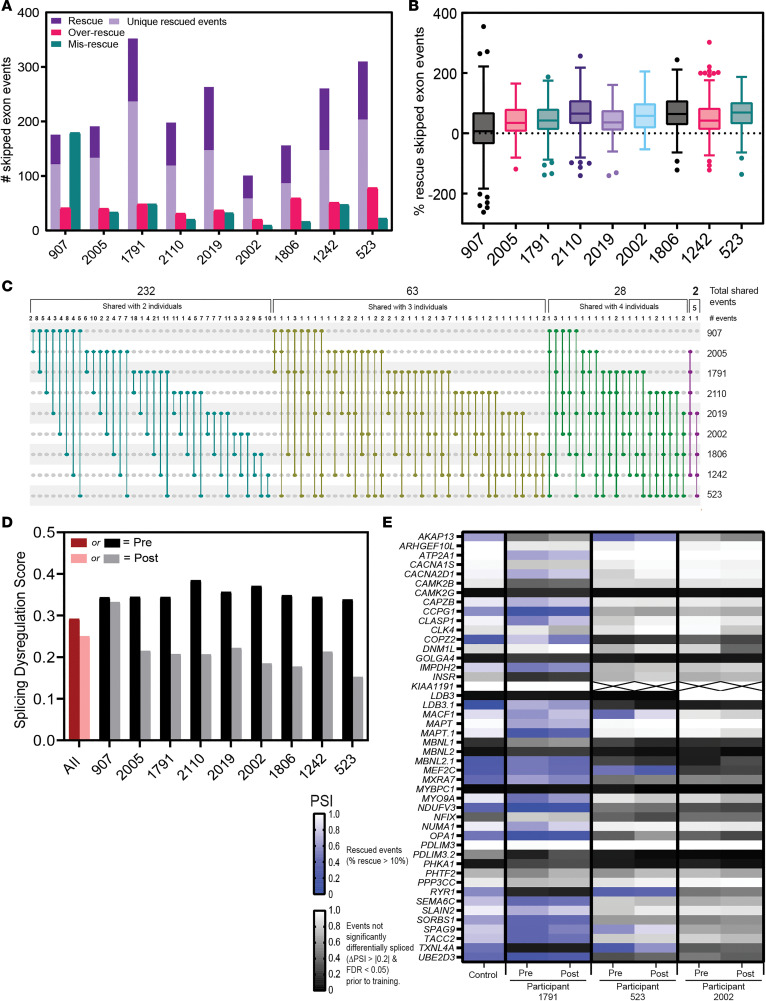
Figure 2. Individual improvement at the level of alternative splicing after strength training.
(A) Number of significant skipped exon events (ΔPSI > 0.2 and FDR < 0.05) of each participant for rescued, overrescued, or misrescued events. Rescued (purple), 10% < PSI < 110%; overrescued (red), PSI ≥ 110% control; and misrescued (green), PSI < –10% opposite direction of control. Rescued events unique to each individual are indicated with light purple. (B) Range of percent rescue values, calculated as: (ΔPSI Pre-Post/ΔPSI Pre-Control) × 100, for all significant skipped exon events for each participant. (C) The overlap of shared rescued events between participants, expressed as total shared events between n individuals, no. of individual shared events within that total, and which individuals between whom those events are shared (connected dots). There are no shared events between 6 or more individuals. (D) Individual (black/gray) and grouped (red/pink) pretraining and posttraining splicing dysregulation scores. Splicing dysregulation scores are quantified as the average absolute ΔPSI of all events significantly misspliced prior to the strength-training program. (E) Heatmap of a panel of 46 skipped exon events that are good predictors of [MBNL]inferred levels (28) for individual with the largest number of rescued events (participant 1791), and greatest (participant 523) and least (participant 2002) clinical improvement. See Supplemental Table 2 for all individual data. Statistically (blue shading) and not statistically (gray shading) significant events illustrated. X boxes in table indicate no reads present for the splicing event. Pre, pretraining sample; post, posttraining sample.

