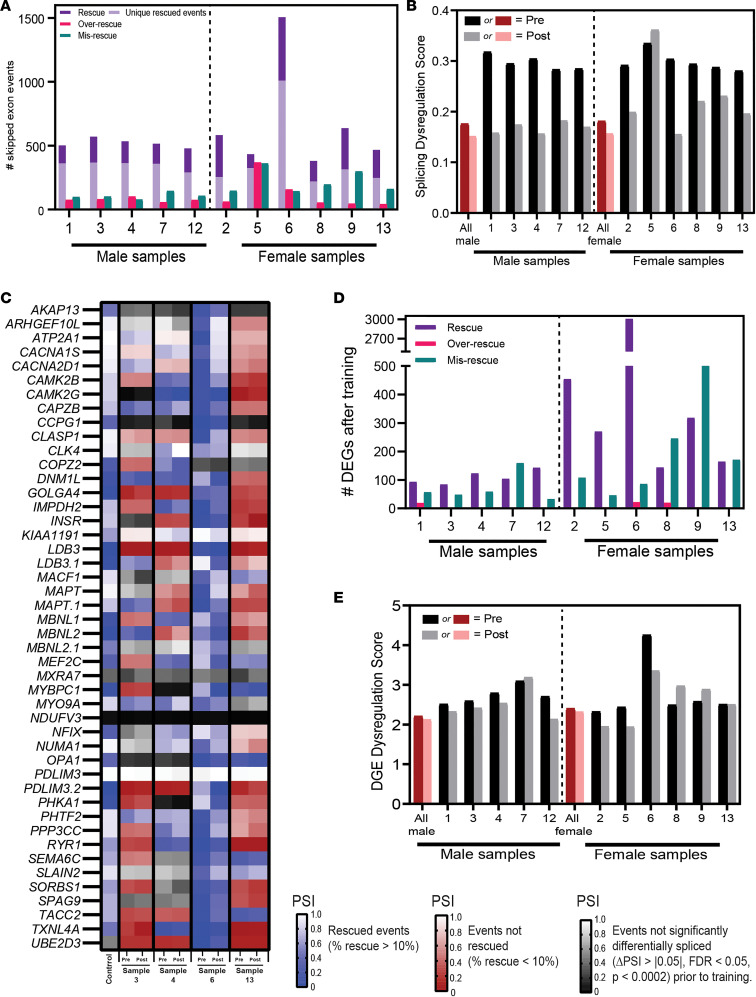
Figure 4. Individual transcriptomic improvements in Mikhail et al. aerobic cycling training data.
Reanalysis of Mikhail et al cycling training (25) RNA-Seq data via individual analysis approach. (A) Number of skipped exon events rescued, overrescued, or misrescued after the cycling training program (ΔPSI > |0.05|,FDR < 0.05, P < 0.0002) for each participant. Rescued (purple), 10% < PSI < 110%; overrescued (red), PSI ≥ 110% control; misrescued (green), PSI < –10% opposite direction of control. Rescued events unique to individual are indicated with light purple. (B) Individual (black/gray) and grouped (red/pink) pre- and posttraining splicing dysregulation scores. Splicing dysregulation scores are quantified as the average absolute ΔPSI of all events significantly misspliced prior to the strength-training program. (C) Heatmap of a panel of 46 skipped exon events that are good predictors of [MBNL]inferred levels (28) for participants with smallest (sample 6), median (sample 13), and greatest (samples 3 and 4) baseline FEV1 values. Statistically significant rescued (blue shading), not rescued (red shading), and not statistically significant (gray shading) events are illustrated. (D) Number of DEGs rescued, overrescued, or misrescued after aerobic training. Rescue was calculated as: (log2FC Pre-Post/log2FC Pre-Control) × 100. (E) Pre- and posttraining DGE dysregulation scores for each individual, as well as individuals grouped together. PSI, percent spliced in; DEGs:,differentially expressed genes; DGE, differential gene expression; 1-RM, 1 repetition maximum.

