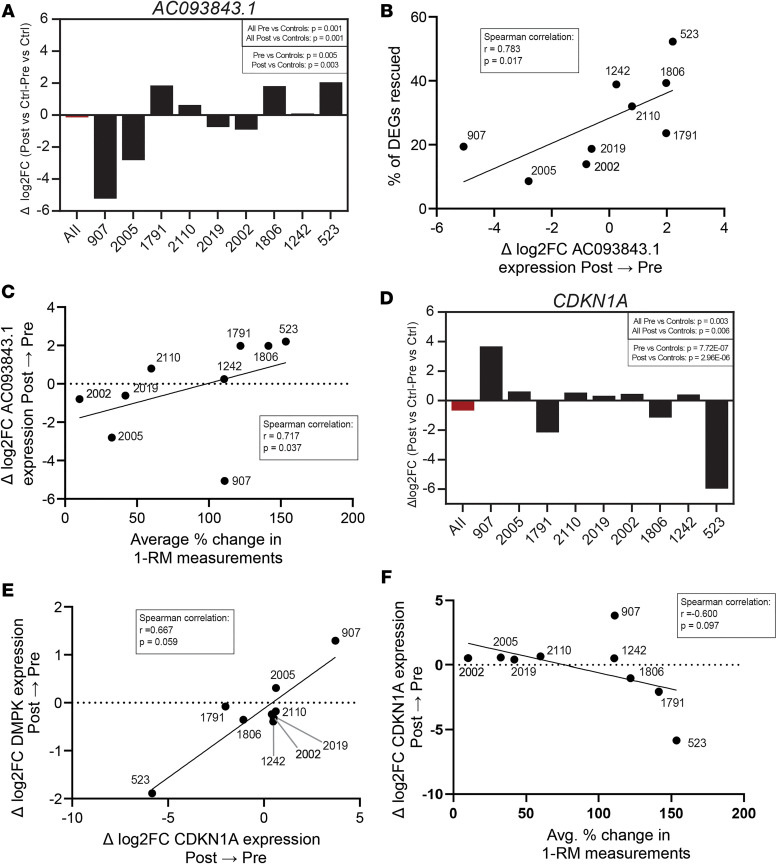
Figure 5. Expression of specific genes correlate with transcriptomic and clinical changes after strength training.
(A) Change in expression of AC093843.1 for each pre- to posttraining individual for individual (black bars) and grouped (red bar) versus unaffected controls. P values were calculated among pretraining individuals, posttraining individuals, grouped pretraining individuals, and grouped posttraining individuals using a quasi-likelihood F test. (B) Spearman correlation between the percentage of DEGs rescued and the change in expression of AC093843.1 after strength training. (C) Spearman correlation between the change in expression of AC093843.1 and the average percent change in 1-RM measurements after strength training. (D) Change in expression of CDKN1A before and after training for individuals as compared with unaffected controls. (E) Spearman correlation between the change in expression of DMPK and the change in expression of CDKN1A after strength training. (F) Spearman correlation between the change in expression of CDKN1A and the average percent change in 1-RM measurements after strength training. DEGs, differentially expressed genes; 1-RM, 1 repetition maximum.

