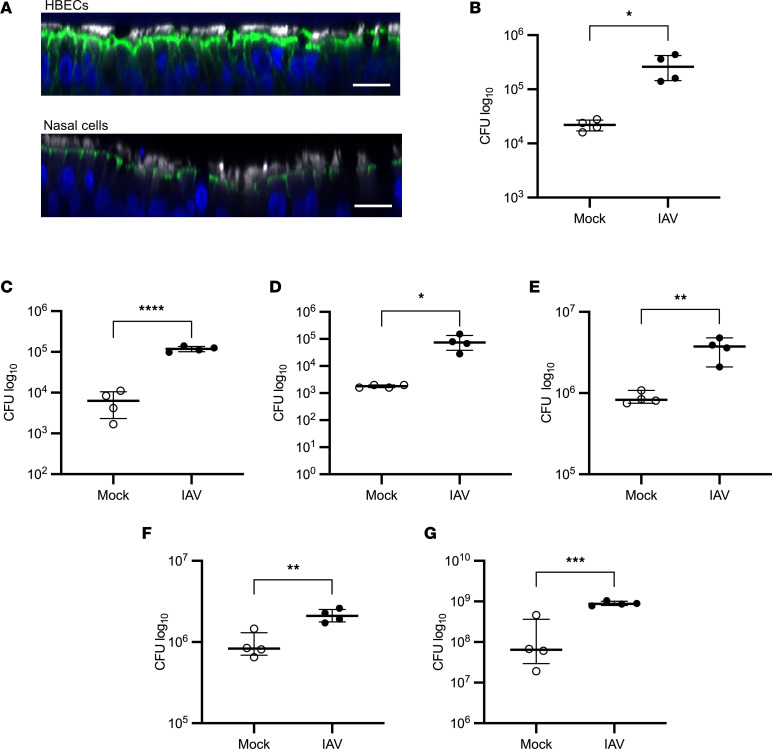
Figure 2. IAV increases the bacterial burden of the ASL in various regions of the airway.
(A) Uninfected HBECs and primary differentiated human nasal cells were fixed in 4% paraformaldehyde, stained for cilia (white), F-actin (green), and DNA (blue), and imaged at ×40 magnification on a Nikon A1R-HD25 confocal microscope. Scale bars: 20 μm. Images are representative of 3 replicates. (B) Primary differentiated human nasal cells, (C) primary differentiated small airway epithelial cells, (D) HBECs isolated from 15-month-old lungs, (E) HBECs isolated from the lungs of a smoker, or (F) primary differentiated ferret bronchial epithelial cells were infected with 100,000 PFU of IAV for 72 hours, followed by infection with 1,000 CFU of Spn. Spn was quantified by vertical plating of apical washed collected after 6 hours of Spn infection (n = 4). (G) HBECs were infected with 100,000 PFU of IAV for 72 hours, followed by infection with 1,000 CFU of Staphylococcus aureus. S. aureus was quantified by vertical plating of apical washed collected after 6 hours of bacterial infection (n = 4). Panels B–G are each representative of 2 independent experiments. All panels were analyzed by unpaired, 2-tailed t test. *P < 0.05, **P < 0.01, ***P < 0.001, ****P < 0.0001. Brackets indicate median and interquartile range. Open circles indicate mock IAV infection; closed circles indicate IAV infection.

