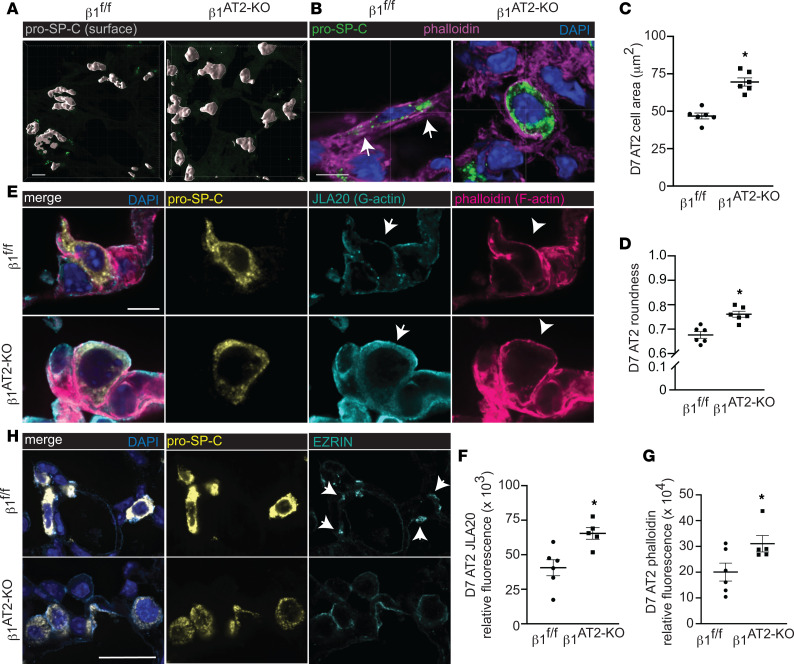
Figure 6. During alveolar repair, β1 integrin regulates actin localization and RhoA GTPase activation.
(A) Surface rendering high-power images of pro–SP-C–immunostained, thick, frozen sections from day 7 (D7) LPS-treated β1fl/fl and β1AT2-KO lungs. (B) High-power images of thick, frozen sections from D7 LPS-treated β1fl/fl and β1AT2-KO lungs immunostained for pro–SP-C (green) with phalloidin F-actin probe (magenta); arrows indicate areas of actin-rich lateral protrusions. (C) Area of pro–SP-C+CD68– AT2 cells from D7 LPS-treated β1fl/fl and β1AT2-KO mice (46.8 ± 2.0 μm2 in β1fl/fl lungs compared with 69.6 ± 2.8 μm2 in β1AT2-KO lungs, n = 6 mice/group, ≥40 cells measured/mouse imaged from 5 sections, 2-tailed t test, P < 0.0001). (D) Roundness score calculated from pro–SP-C+CD68– cells from D7 LPS-treated β1fl/fl and β1AT2-KO mice (38–60 cells measured/mouse from 5 sections, n = 6 mice/group, 2-tailed t test comparing genotypes, P = 0.0009). (E) High-power images of frozen sections prepared at D7 after LPS β1fl/fl and β1AT2-KO lungs immunostained for pro–SP-C (gold) with JLA20 (cyan) and phalloidin (magenta) probes applied to detect G-actin and F-actin, respectively. Membrane localization of G-actin denoted by arrows and F-actin by arrowheads. (F and G) Quantification of JLA20 (F) and phalloidin (G) expression in pro–SP-C+ AT2 cells in β1fl/fl and β1AT2-KO lungs D7 after LPS (n = 5–6 mice/group, 10 sections/mouse, 2-tailed t test with P = 0.0088 for JLA20 and P = 0.0482 for phalloidin). (H) Representative high-power images from D7 LPS-treated β1fl/fl and β1AT2-KO lungs immunostained for ezrin (cyan) with AT2 cells identified by RNA in situ hybridization for Sftpc (gold). Arrows indicate ezrin expression localized to lateral extensions in β1fl/fl AT2 cells, whereas diffuse, nonfocal ezrin expression along the cell membrane is seen in β1AT2-KO AT2 cells. * P < 0.05. Scale bar = 5 μm for A, B, and E; scale bar = 25 μm for panels in H.

