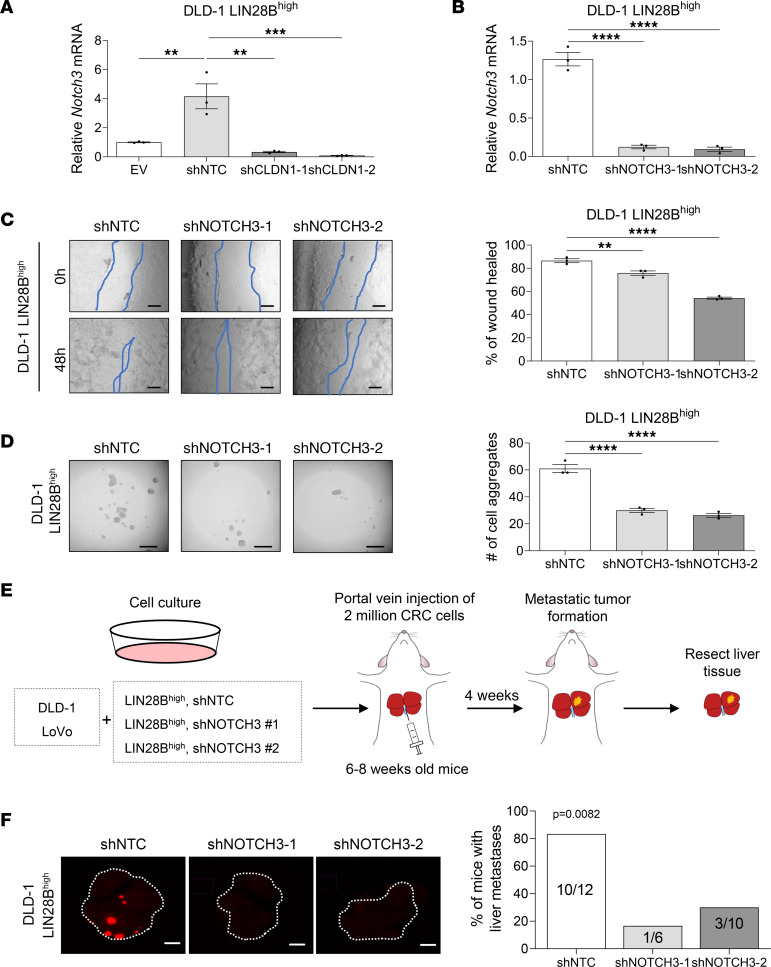
Figure 5. NOTCH3 regulates collective cell invasion and liver metastasis formation downstream of LIN28B/CLDN1 axis.
(A) qRT-PCR analysis of NOTCH3 mRNA in DLD-1 LIN28Bhi cells with or without shCLDN1. (B) qRT-PCR analysis of NOTCH3 mRNA in DLD-1 LIN28Bhi cells with or without shNOTCH3. (C) Wound closure of DLD-1 LIN28Bhi cells with or without shNOTCH3. Scale bar = 200 μm (left). Wound-healing rates were quantified by ImageJ (right graph). Data represented as means ± SEM (n = 3). (D) Representative images of aggregates formed from DLD-1 LIN28Bhi cells transduced by shNOTCH3 (left). The number of cell aggregates was counted by Keyence BZ-X810 (right graph). Data represented as means ± SEM (n = 3). (E) Schematic drawing of the workflow used to study the effects of NOTCH3 knockdown on portal vein injection model of metastatic CRC. (F) Representative images of RFP expressed by DLD-1 LIN28Bhi tumors in the liver. Images were taken using Keyence BZ-X810. Scale bar = 500 μm. Data in A–D were analyzed by 1-way ANOVA followed by Tukey’s multiple-comparison test. Data in F were analyzed by χ2 test. **P < 0.01, ***P < 0.001, ****P < 0.0001.

