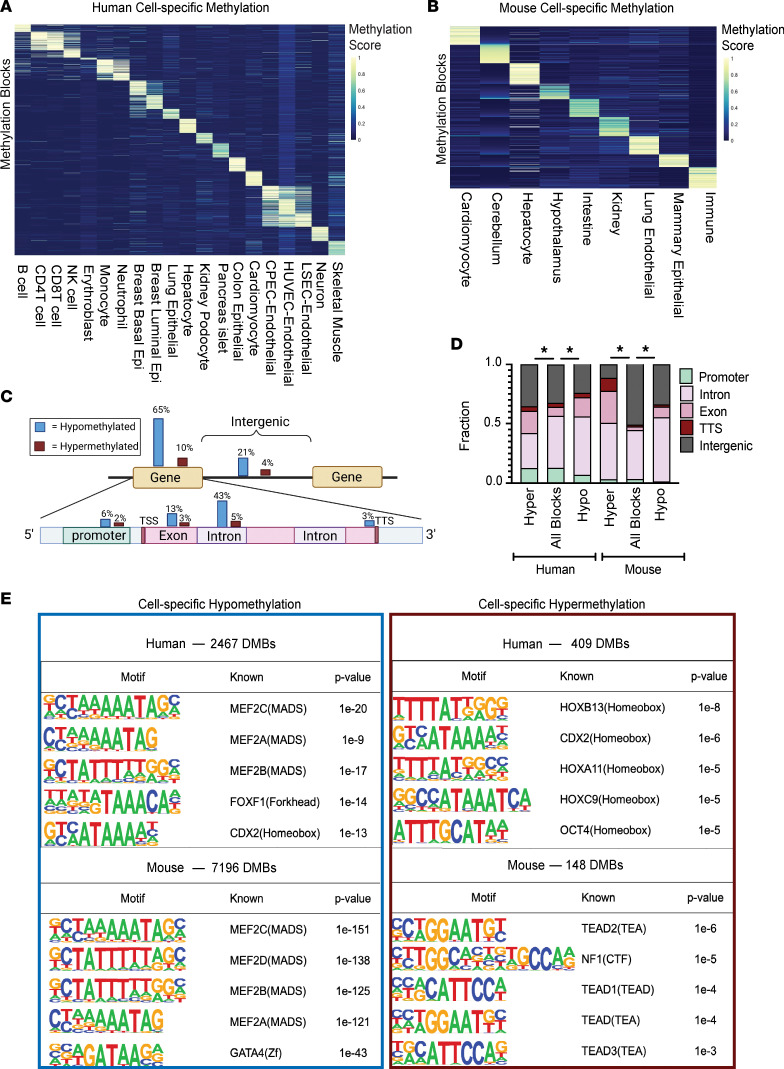
Figure 3. Cell-type-specific DNA blocks are mostly hypomethylated, enriched at intragenic regions and developmental transcription factor (TF) binding motifs.
(A and B) Heatmaps of differentially methylated cell-type-specific blocks identified from reference WGBS data compiled from healthy cell types and tissues in human (A) and mouse (B). Each cell in the plot marks the methylation score of 1 genomic region (rows) at each of the 20 cell types in human and 9 in mouse (columns). Up to 100 blocks with the highest methylation score are shown per cell type. The methylation score represents the number of fully unmethylated or methylated read pairs/total coverage for hypo- and hypermethylated blocks, respectively. (C) Schematic diagram depicting location of human cell-type-specific hypo- and hypermethylated blocks. Genomic annotations of cell-type-specific methylation blocks were determined by analysis using HOMER. (D) Distribution of human (left) and mouse (right) cell-type-specific methylation blocks relative to genomic regions used in the hybridization capture probes. Captured blocks with less than 5% variance across cell types represent blocks without cell-type specificity and were used as background. *P < 0.05 by χ2 test (degrees of freedom = 4). (E) Total number and top 5 TF binding sites enriched among cell-type-specific differentially methylated blocks (DMBs) in human (top) and mouse (bottom), using HOMER motif analysis (cumulative hypergeometric distribution statistic). As above, captured blocks with less than 5% variance across cell types were used as background.

